


 28 / 61

CARDIOVASCULAR JOURNAL OF AFRICA • Volume 32, No 4, July/August 2021
200
AFRICA
familiar to participants, 53.6% answering that alcohol doesn’t
affect blood pressure. Table 2 shows participants’ response to
knowledge questions.
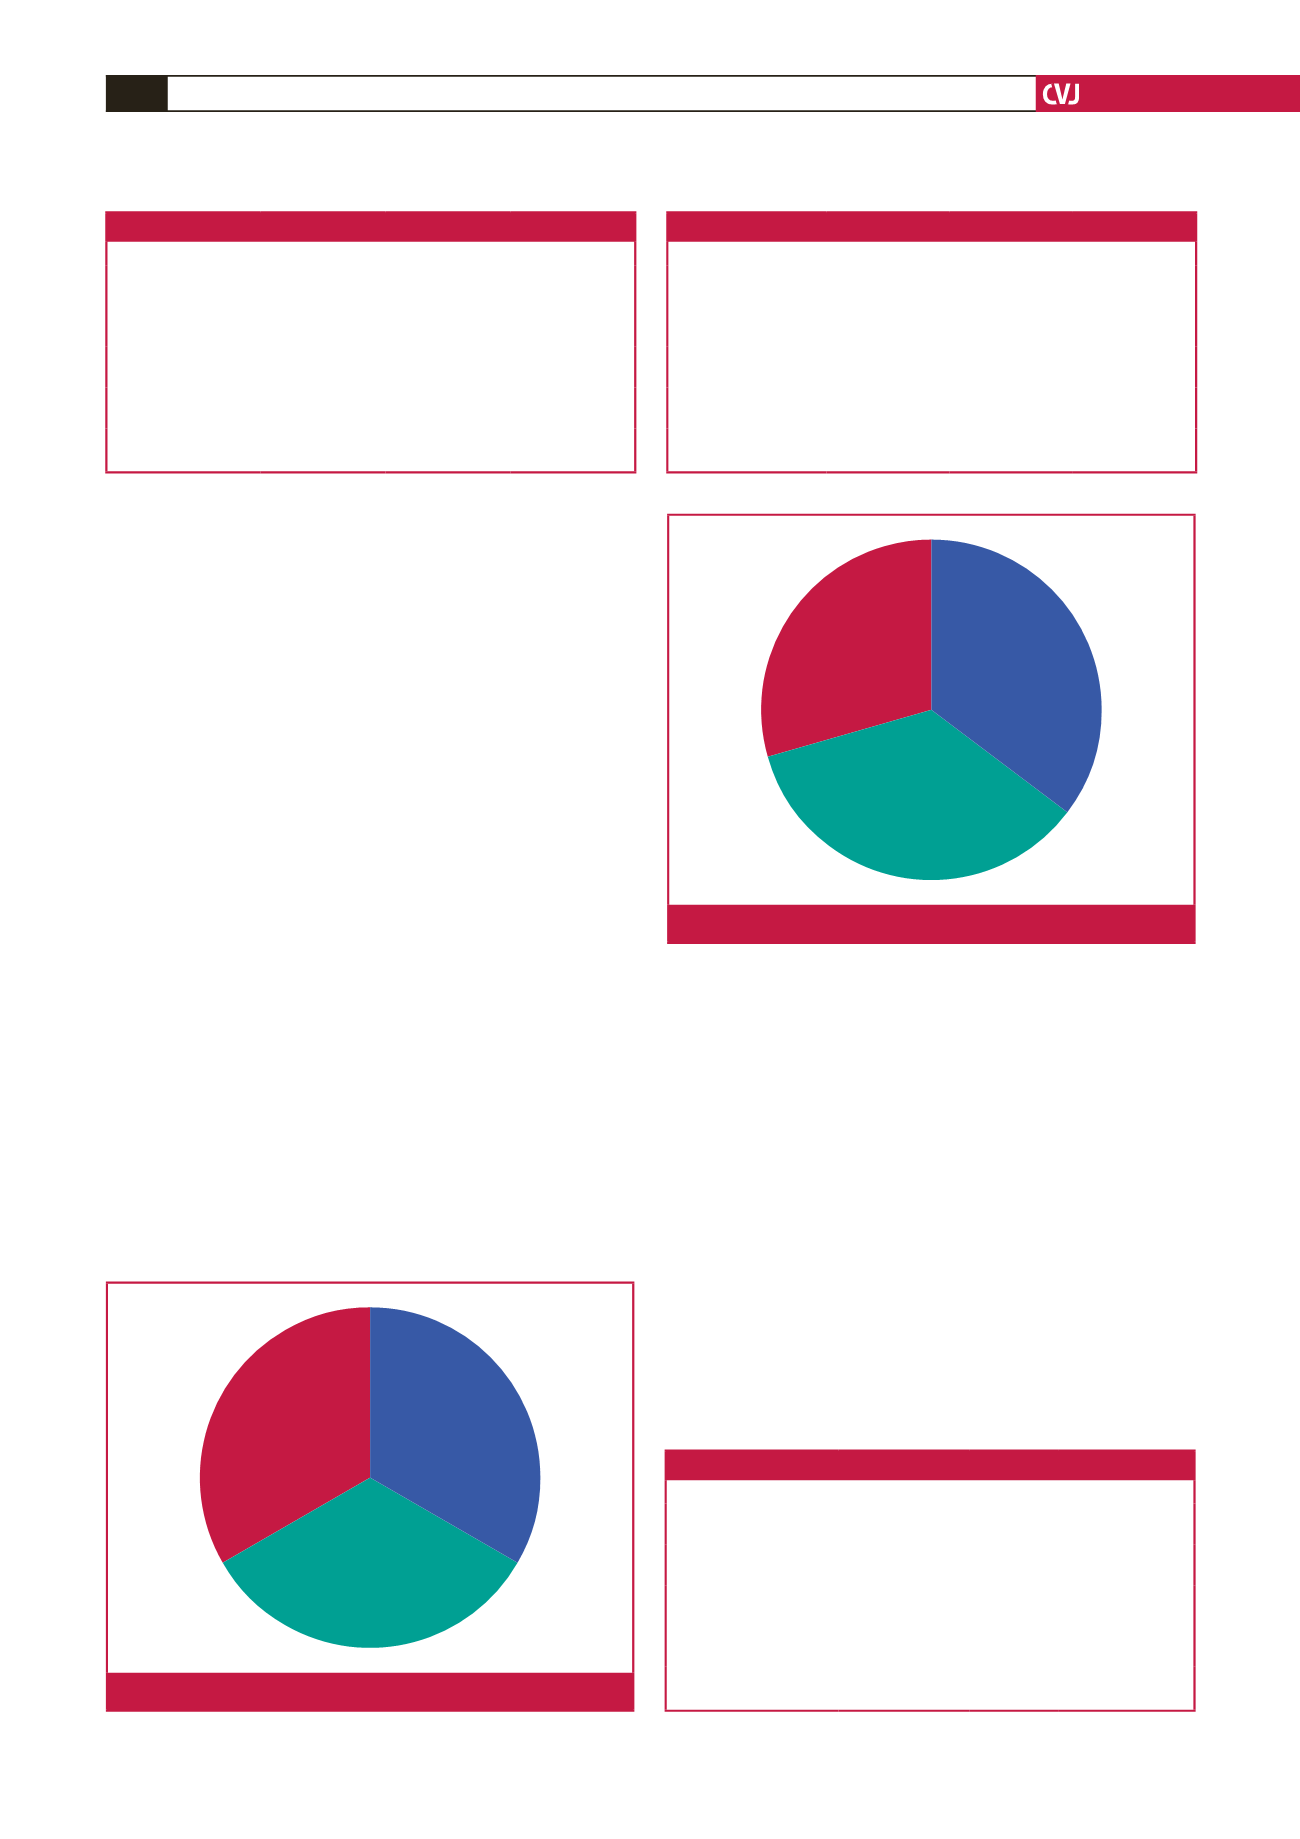
Knowledge scores were calculated from the seven questions
on knowledge and categorised into below-average (zero to three
correct answers), average (four to five correct answers) and
above-average (six to seven correct answers) knowledge levels.
Only 31.3% of participants had above-average knowledge on
blood pressure and TLC, most respondents answering more than
two questions incorrectly. Fig. 2 gives overall knowledge scores.
Regarding participants’ perception of consultation with
doctors, they were asked specifically about each lifestyle change
they were counselled upon and the perceived duration they
thought they were counselled for on lifestyle changes by a medical
professional (Table 3). Seventeen respondents said they were
never counselled on lifestyle changes, while of those who were
counselled, the most frequent perceived duration of consultation
was reported to be ‘less than five minutes’ (33.9%) (Fig. 3).
Attitude and practice
Participants were asked questions on their adherence to TLC,
and the barriers they perceived were preventing them from
implementing such changes if they were not adherent. The
respondents were then categorised into different groups of level
of implementation based on their responses.
Regarding the five questions asked on implementation
of therapeutic lifestyle changes, refraining from alcohol
consumption was the lifestyle change most frequently adhered
to, with 100% of respondents reporting no alcohol consumption,
followed by smoking cessation with 96.4% saying they did not
smoke. The lifestyle change respondents were least adherent to
was regular exercise, with 59.8% of participants admitting to not
exercising on most days (Table 4).
After categorising participants’ implementation level into
‘poor’, ‘good’ or ‘full implementation’ according to the number
of changes adhered to, only 29.5% of respondents were found
to be fully implementing TLC, with 25% classified as poor
implementation (zero to two changes) and 45.5% classified as
good implementation (three or four changes) (Fig 4).
Concerning patients’ perceived barriers to implementing TLC,
their most frequent response to why they were not implementing
a certain change was that they did not feel it mattered enough,
the same answer being most frequent for each lifestyle change
(Table 5, Figs 5–7).
Above average
Average
Below average
Fig. 2.
Overall knowledge score.
Less than 5 min
5–10 min
More than 10 min
Fig. 3.
Participants’ perceived consultation time.
Table 2. Participants’ response to knowledge questions
Question
Answer
Number
Percentage
Salt consumption
Yes
No
105
7
93.8
6.3
Being overweight
Yes
No
74
38
66.1
33.9
Exercise
Yes
No
80
32
71.4
28.6
Smoking
Yes
No
64
48
57.1
42.9
Alcohol consumption
Yes
No
52
60
46.4
53.6
Table 4. Participants’ implementation of TLC
TLC
Answer
Number
Percentage
Minimising salt intake
Yes
No
95
17
84.8
15.2
Weight-loss plan
Yes
No
87
25
77.7
22.3
Regular exercise
Yes
No
45
67
40.2
59.8
Smoking
Yes
No
4
108
3.6
96.4
Alcohol consumption
Yes
No
0
100
0
100
Table 3.Which lifestyle changes participants received counselling on
Lifestyle change
Answer
Number
Percentage
Salt consumption
Yes
No
81
31
72.3
27.7
Being overweight
Yes
No
48
64
42.9
57.1
Exercise
Yes
No
53
59
47.3
52.7
Smoking
Yes
No
45
67
40.2
59.8
Alcohol consumption
Yes
No
24
88
21.4
78.6