


 27 / 61

CARDIOVASCULAR JOURNAL OF AFRICA • Volume 32, No 4, July/August 2021
AFRICA
199
specialising in cardiology. It is located in the centre of Khartoum.
It has three main specialities, cardiology, renal and neurology.
There are two cardiology wards for male and female patients with
a total of 48 beds, a CCU with six beds and two intermediate-
care units attached to the CCU, accommodating 12 beds.
Cardiology referral clinics are available every day of the week.
Patients between the ages of 25 and 70 years attending
follow up at the cardiology referral clinics in the Ahmed
Gasim and El-Shaab hospitals who were previously diagnosed
as hypertensive made up the study population. Patients with
co-morbidities and those who had had a previous cardiovascular
event were included. Patients excluded were those who did not
give consent to participate or were admitted to hospital.
There was no sample frame since the sampling was
non-probability due to the lack of a registry for hypertension
patients. The sample selection method was full coverage of
hypertensive patients attending the cardiology referral clinic
of El-Shaab Teaching Hospital on Sundays, Tuesdays and
Thursdays during the period from 14 August to 1 September
2016 and of all hypertensive patients attending the cardiology
referral clinic of Ahmed Gasim Hospital on Sundays, Tuesdays
and Thursdays during the period from 4 to 22 September 2016.
Ethical approval for this study was obtained from the ethics
review board at the University of Khartoum. Informed verbal
consent for participation was obtained from each subject in the
study. The author declares no conflict of interest. Information
obtained from subjects was held confidentially and used strictly
for academic purposes only.
Statistical analysis
A structured interview using an anonymous questionnaire was
used for collection of data. Descriptive and inferential statistics
were used for data analysis. Software used was SPSS version
21.0.
Independent variables were socio-demographic data of
patients, occurrence of previous cardiovascular events, duration
of consultations and knowledge level. Dependent variables were
different levels of TLC implementation and knowledge level.
Results
We identified 112 hypertensive patients for inclusion in the
study, with 100% consenting and completing the study. Of
the participants, there was a slight preponderance of females
(54.5%) and older age, with 58% in the 55- to 70-year age
group, the majority being married (88.4%). Participants were
of varying education levels, with primary school education the
most frequently attained level of education (27.7%). A high
proportion of participants were unemployed (43.8%) and most
had not experienced a previous cardiovascular event (67.9%).
Table 1 shows the demographics of the study population.
Knowledge
To determine the participants’ level of knowledge on blood
pressure and therapeutic lifestyle changes, respondents were
asked seven questions, five pertaining to lifestyle changes, one
question on the ideal blood pressure and one on the general
management of hypertension. Respondents were then given a
score out of seven depending on their answers, and categorised
as ‘below average’, ‘average’ or ‘above average’ in knowledge
level.
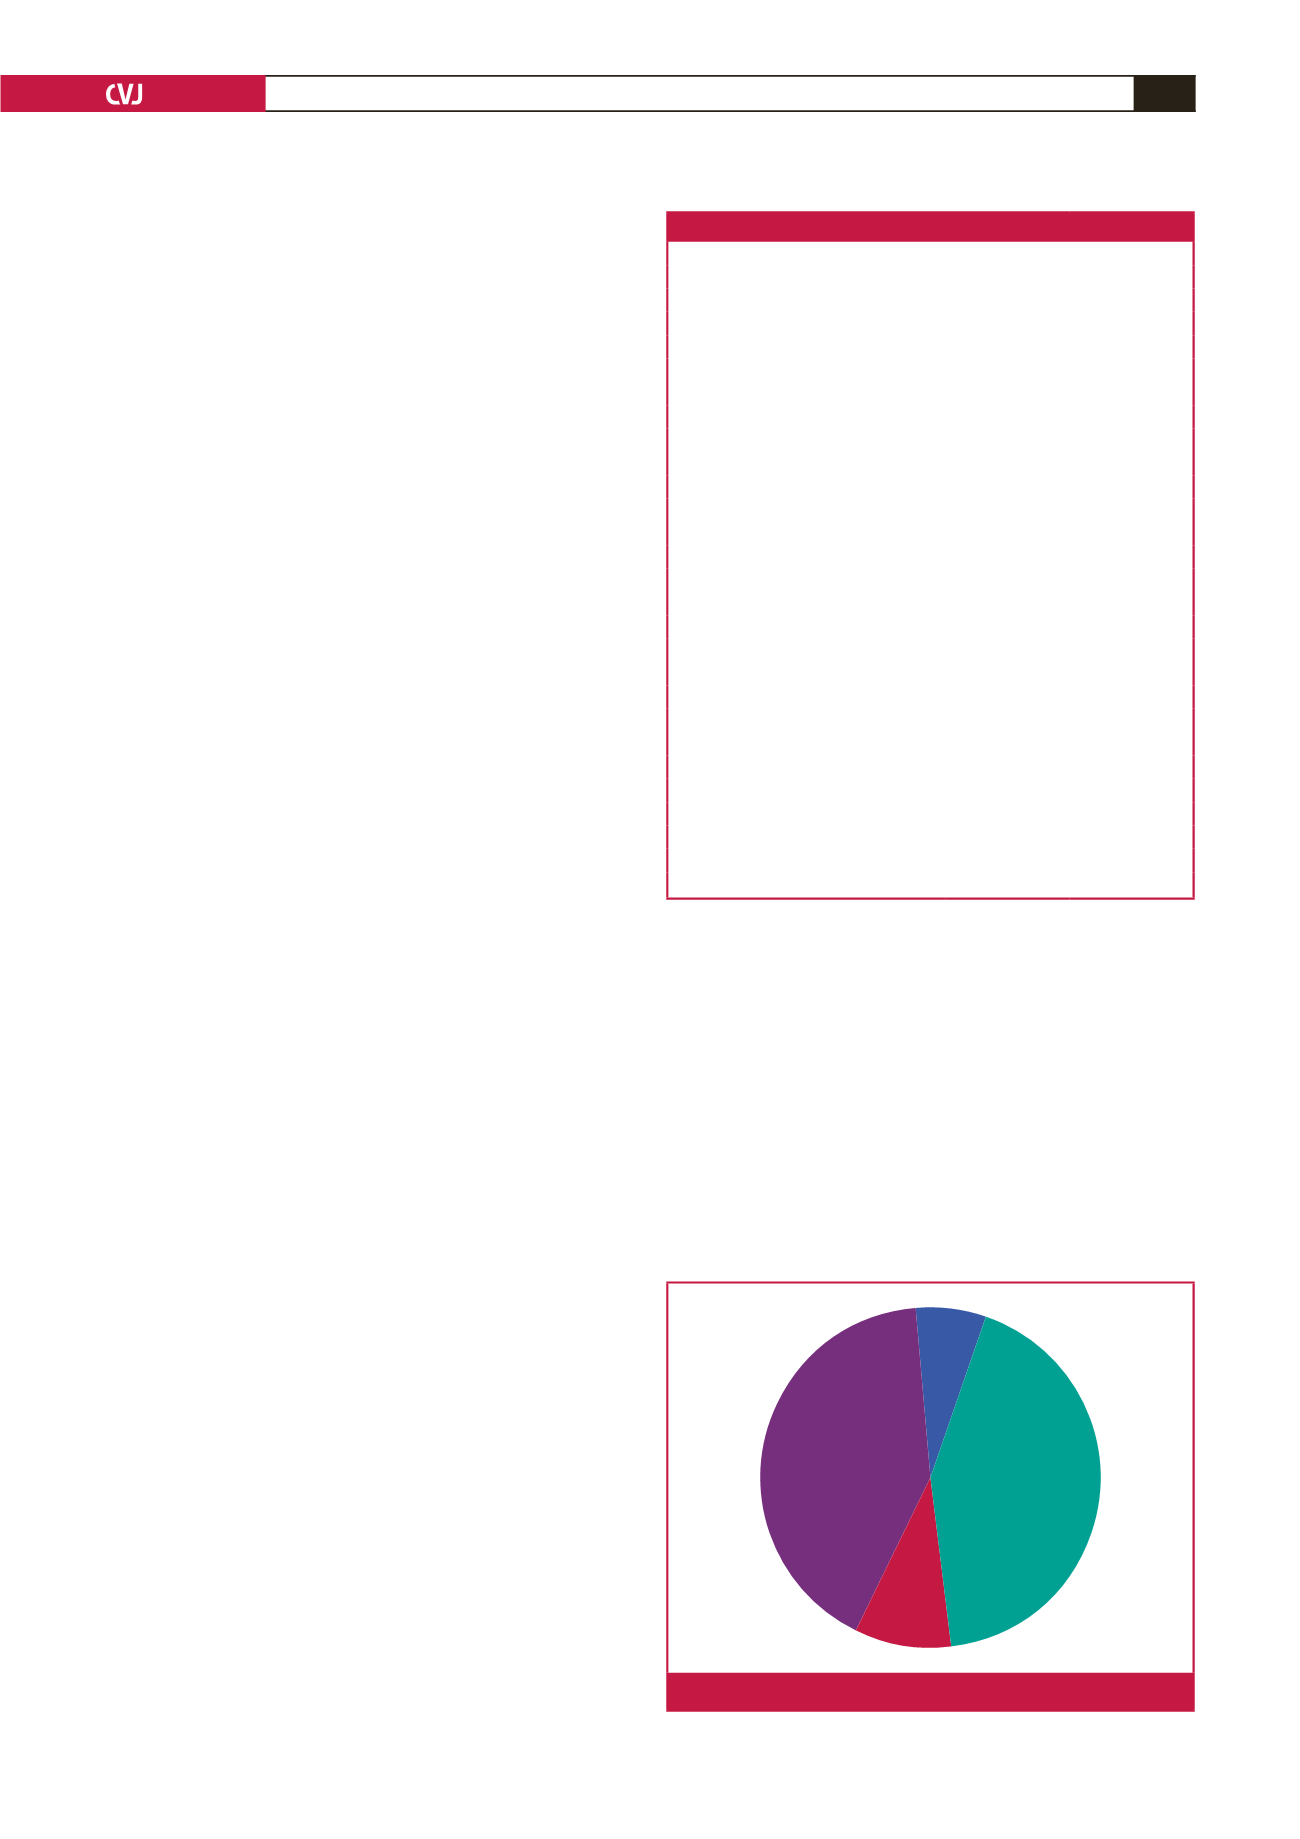
Regarding ideal blood pressure knowledge, 53.6% of
respondents did not know what their ideal blood pressure should
be (Fig. 1). When asked what the optimal mode of hypertension
management was, most patients (73.2%) answered correctly,
stating both antihypertensives and lifestyle changes.
When assessed for knowledge on lifestyle and habits that affect
blood pressure, respondents were most familiar with the fact
that salt consumption affects blood pressure, 93.8% answering
correctly. Alcohol’s effect on blood pressure was the least
100/60
mmHg
120/80 mmHg
140/100
mmHg
Don’t know
Fig. 1.
Knowledge question on ideal blood pressure.
Table 1. Socio-demographic characteristics of the participants
Characteristics
Number
Percentage
Gender
Male
51
45.5
Female
51
45.5
Age, years
25–39
9
8
40–54
38
33.9
55–70
65
58
Marital status
Single
6
5.4
Married
99
88.4
Widowed
4
3.6
Divorced
3
2.7
Education level
Primary school
31
27.7
Secondary school
24
21.4
Higher education
15
13.4
Illiterate
23
20.5
Khalwa
19
17
Occupation
Unemployed
49
43.8
Labourer
3
2.7
Service job
18
16.1
Self employed
24
21.4
Retired
18
16.1
Previous cardiovascular event
Yes
36
32.1
No
76
67.9