
CARDIOVASCULAR JOURNAL OF AFRICA • Volume 25, No 6, November/December 2014
272
AFRICA
40s and 60s (
p
=
0.002 and 0.035, respectively). The lack of
significance in the
+
70s group could have been due to the small
sample size of this age decade.
Of note, the rate of increase in HTN prevalence was somewhat
different between the genders; the slopes of the regression lines
for males and females were 10.66 and 13.2, respectively. In
addition, there was a dramatic increase in HTN prevalence in
females between the age decades 30s and 40s, compared to that
in males.
The Gambia and Sierra Leone patients
To check whether there were large differences in the demographics
of subjects between the Gambia and Sierra Leone, the collected
records for the year 2000 in the Gambia and the year 2001 in
Sierra Leone were compared for the criteria SBP, DBP and HTN
prevalence. Only the year 2001 was chosen to represent the data
collected from Sierra Leone because the population sizes in the
years 2000 and 2001 were comparable (Table 3).
The
χ
2
-test indicated more females and fewer males in the
Gambia (
p
<
0.0001). The
t
-test showed that DBP means seemed
to be similar between subjects from both countries (
p
=
0.21),
while age and SBP means seemed to be different (
p
=
0.0001 and
p
=
0.0002, respectively), with Sierra Leone having higher means.
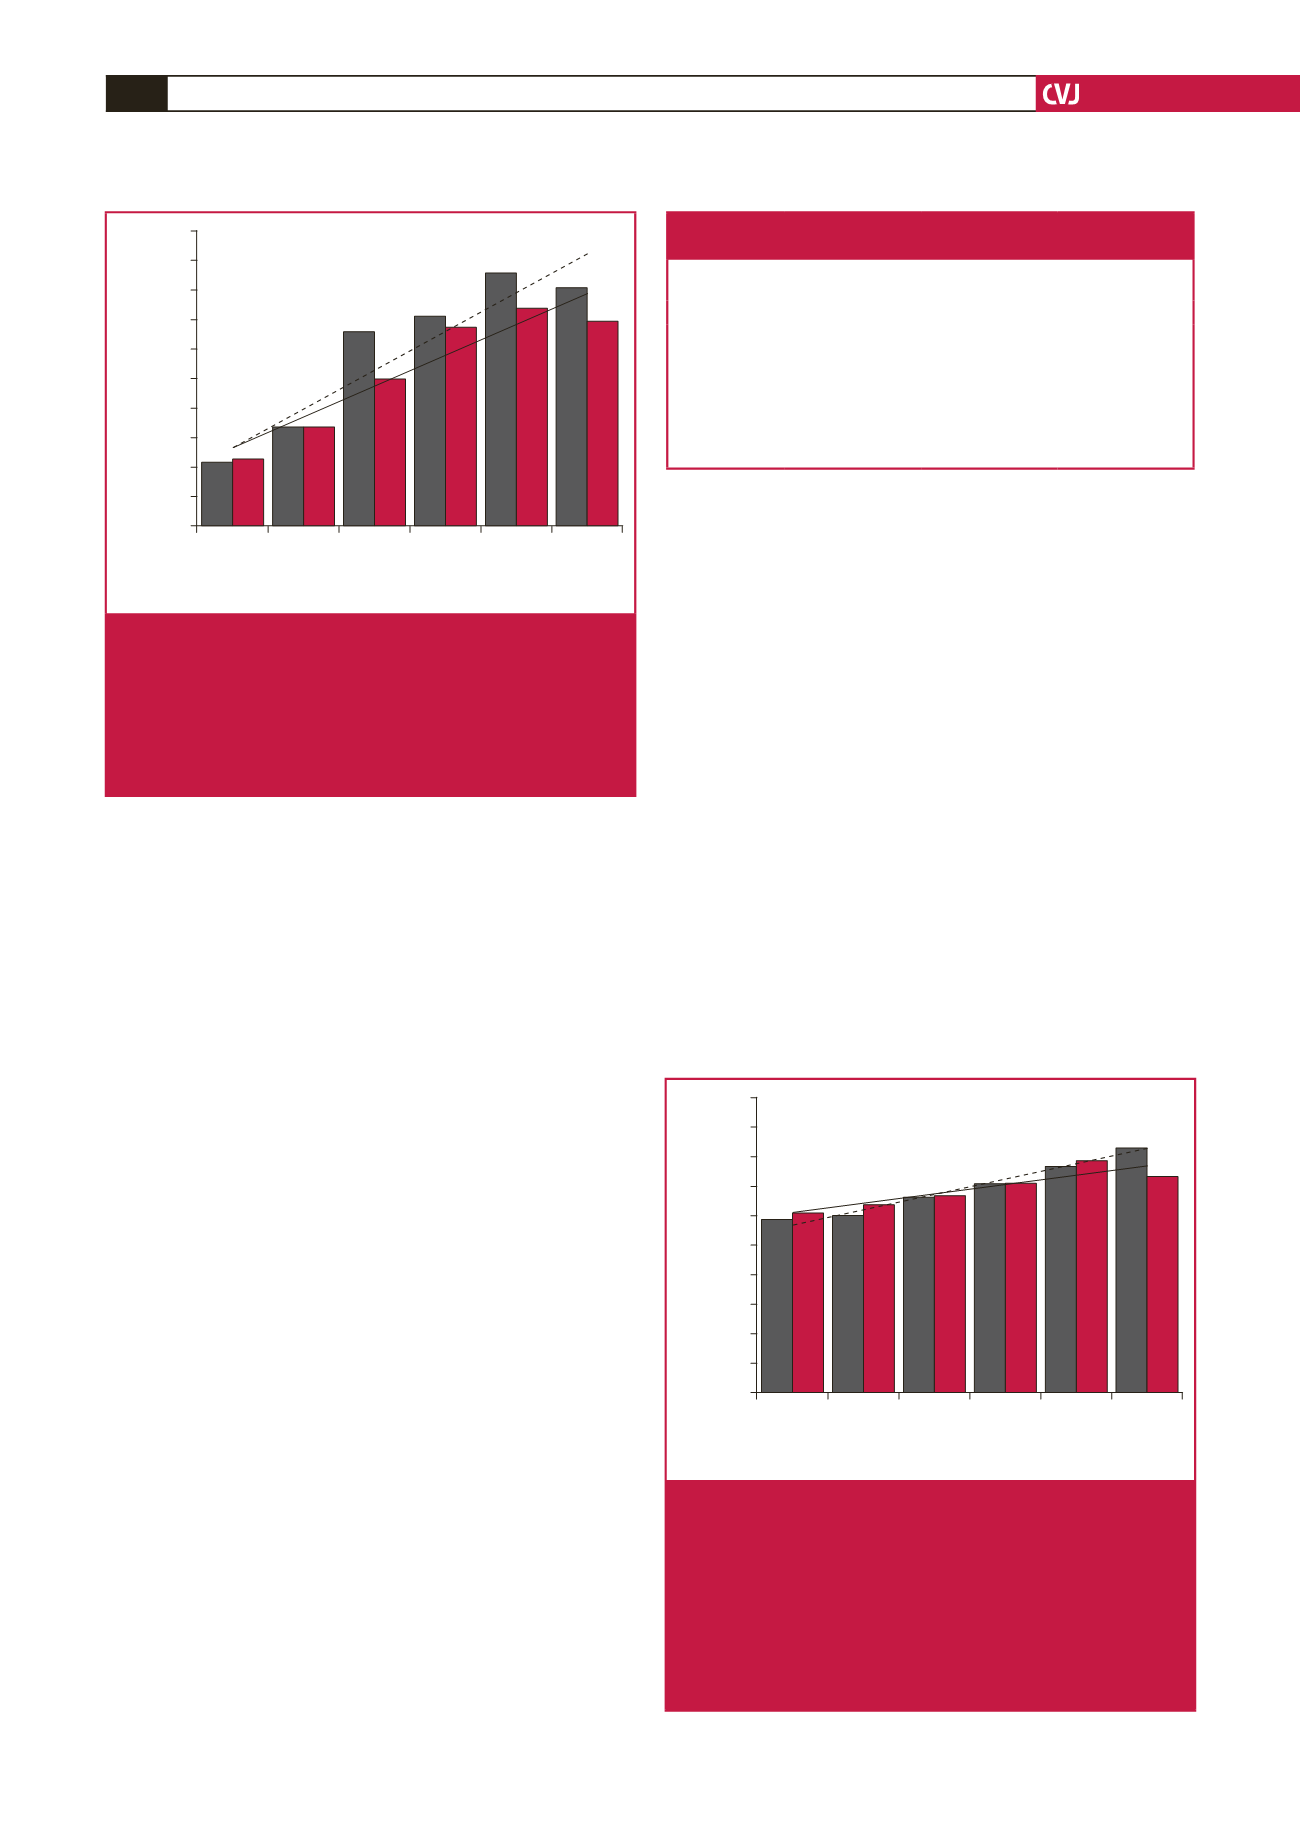
Furthermore, SBP and DBP means continually increased
with age decade for both the Gambia and Sierra Leone subjects
(Figs 4 and 5, respectively). In Sierra Leone, there were higher
SBP means in the age decades 20s and 30s (
p
=
0.013 and
p
=
0.002, respectively) and lower SBP means in the age decade
≥
70s (
p
=
0.026) in comparison with SBP means in the Gambia,
as shown in Fig. 4.
The increase in mean SBP seemed to be faster in the Gambia
when compared with Sierra Leone, based on the regression line
slopes of 10.04 and 6.32, respectively (Fig. 4). Similarly, the
increase in mean DBP seemed to be faster in the Gambia when
compared with Sierra Leone, based on the regression line slopes
of 4.58 and 3.08, respectively (Fig. 5). As shown in Fig. 5, DBP
mean in the Gambia was higher than in Sierra Leone in the age
decade
≥
70s (
p
=
0.041). The Wilcoxon test was more trusted for
the small sample size, which was the case in the age decade
≥
70s.
HTN prevalence appeared to be continually increasing with
age decade for both the Gambia and Sierra Leone (Fig. 6).
However, this increase seemed to be occurring at a faster rate
in the Gambia than in Sierra Leone, as detected by the trend
line slopes of 14.07 and 10.30, respectively. In addition, HTN
prevalence in Sierra Leone was higher in the age decades 20s and
50s (
p
<
0.0001 and
p
=
0.015, respectively) compared to HTN
prevalence in the Gambia.
Overall, among adults with known age
≥
20 years old, the
HTN prevalence rates in the Gambia in 2000 and in Sierra Leone
in 2001 were 32.4 and 46.6%, respectively, while the Fisher’s exact
test showed a significant difference between both values (
p
<
0.0001). The Cochran–Armitage trend test showed a significant
difference between the HTN prevalence of each age decade by
country (
p
<
0.0001).
Table 3. Characteristics of patients with known age
≥
18 years in the
Gambia (2000) and Sierra Leone (2001)
Variable
The Gambia
(n
=
560*)
Sierra Leone
(n
=
659)
p-value
†
Age (years)
36.0
±
15.3
39.5
±
16.0
0.0001
SBP (mmHg)
126.7
±
26.1
132.1
±
24.6
0.0002
DBP (mmHg)
80.4
±
15.8
81.5
±
14.5
0.21
Values: mean
±
SD.
*The Gambia:
n
=
561 for age and SBP and
n
=
560 for DBP.
†
Student’s
t
-test.
SD
=
standard deviation, SBP
=
systolic blood pressure, DBP
=
diastolic blood
pressure.
100
90
80
70
60
50
40
30
20
10
0
F M F M F M F M F M F M
20s 30s 40s 50s 60s
≥
70s
Age decade by gender
Hypertension prevalence (%)
21.8
33.8
66.3
71.7
86.5
81.5
23.1
0.71
>
0.99
0.002
0.54
0.035
0.16
34.0
50.3
68.0
74.3
70.0
Fig. 3.
HTN prevalence in patients with known age
≥
20 years.
Histogram of HTN prevalence rates (%). Females
=
grey bars and dashed line, males
=
red bars and solid
line. Regression equations:
y
=
13.2
x
+
14.06 (
R
=
0.935) for females and
y
=
10.66
x
+
15.97 (
R
=
0.944)
for males.
p
-values: Fisher’s exact test. F
=
females, M
=
males, HTN
=
hypertension.
200
180
160
140
120
100
80
60
40
20
0
G S G S G S G S G S G S
20s 30s 40s 50s 60s
≥
70s
Age decade
Systolic blood pressure (mmHg)
117.9
±
17.8
120.7
±
16.9
133.1
±
28.1
142.0
±
32.2
153.9
±
24.3
166.5
±
35.3
122.4
±
18.5
127.8
±
22.3
134.1
±
22.3
142.4
±
23.7
157.9
±
30.6
146.9
±
23.2
0.013
0.002
0.82
0.93
0.51
0.026
Fig. 4.
Mean SBP of patients with known age
≥
20 years in the
Gambia (2000) and Sierra Leone (2001). Histogram of
mean SBP
±
SD. The Gambia
=
grey bars and dashed
line, Sierra Leone
=
red bars and solid line. Regression
equations:
y
=
10.04
x
+
103.8 (
R
=
0.989) for the
Gambia and
y
=
6.318
x
+
116.4 (
R
=
0.903) for Sierra
Leone.
p
-values: Student’s
t
-test. G
=
the Gambia, S
=
Sierra Leone, SD
=
standard deviation, SBP
=
systolic
blood pressure.


