
CARDIOVASCULAR JOURNAL OF AFRICA • Volume 25, No 6, November/December 2014
AFRICA
273
Sierra Leone patients
To check whether there was a trend in the data collected in
Sierra Leone over the years 2001–2003 and 2009, ANOVA
was performed on SBP and DBP LSmeans, adjusted for the
relationship with age and separated by gender (Table 4). Adjusted
for age, SBP LSmean in females was similar between 2009 and
2003 (
p
=
0.84), higher in 2003 than in 2001 (
p
=
0.003), and
higher in 2001 than in 2002 (
p
=
0.014). DBP LSmean in females
was higher in 2003 than in 2009 (
p
=
0.0002), similar between
2009 and 2001 (
p
=
0.13), similar between 2001 and 2002 (
p
=
0.35), and lower in 2002 than in 2009 and 2003 (
p
=
0.029 and
p
<
0.0001, respectively).
After age adjustment, SBP LSmean in males was higher in
2003 than in 2009 (
p
=
0.043), higher in 2009 than in 2002 (
p
=
0.002), and similar between 2002 and 2001 (
p
=
0.73). DBP
LSmean in males was higher in 2003 than in 2009 (
p
<
0.0001),
similar between 2009 and 2002 (
p
=
0.068), similar between 2002
and 2001 (
p
=
0.41), lower in 2001 than in 2009 and 2003 (
p
=
0.022 and
p
<
0.0001, respectively). To summarise, SBP and DBP
LSmeans were generally higher in 2003 and 2009 compared to
those in 2001 and 2002.
Discussion
SBP, DBP and HTN trends
Mean SBP was shown to increase with age decade in both males
and females (Fig. 1). There was a significant difference in mean
SBP between the genders after age adjustment, with females
having a higher mean SBP. Previous studies in Kenya, Tanzania,
the Gambia and West Africa showed an increase in SBP with
increasing age in both genders.
1,21,23,28
The study in Tanzania
showed that the increase in mean SBP with age was steeper in
females.
21
Mean DBP increased with age decade and then plateaued
as age decade reached
+
70s in both males and females (Fig. 2),
which was similar to a previous study in the Gambia.
23
Prior
studies showed that mean DBP increased with age and then
plateaued by ages 45–54 and 55–64 years in Tanzania and West
Africa, respectively.
21,28
Our study showed that females had a
higher mean DBP than males after age adjustment.
HTN prevalence was shown to increase with age decade
for both males and females (Fig. 3). Previous studies in Sierra
Leone, Kenya and West Africa showed that HTN prevalence
rates increased with age in both genders.
1,28,29
Comparing males to
females, we found that females had higher odds and risk of HTN
than males. Similarly, studies in Tanzania and Uganda showed
that HTN was significantly higher in females.
21,30
This may have
been due to post-menopausal hormonal changes.
31
Females
showed a relatively higher HTN prevalence, starting with the age
120
100
80
60
40
20
0
G S G S G S G S G S G S
20s 30s 40s 50s 60s
≥
70s
Age decade
Diastolic blood pressure (mmHg)
74.8
±
13.1
78.7
±
11.5
86.3
±
17.3
87.5
±
14.4
93.7
±
12.4
97.6
±
21.3
75.3
±
12.3
79.5
±
14.0
85.1
±
12.9
88.3
±
14.3
92.4
±
15.4
88.5
±
11.5
0.71
0.59
0.63
0.76
0.68
*0.041
0.072
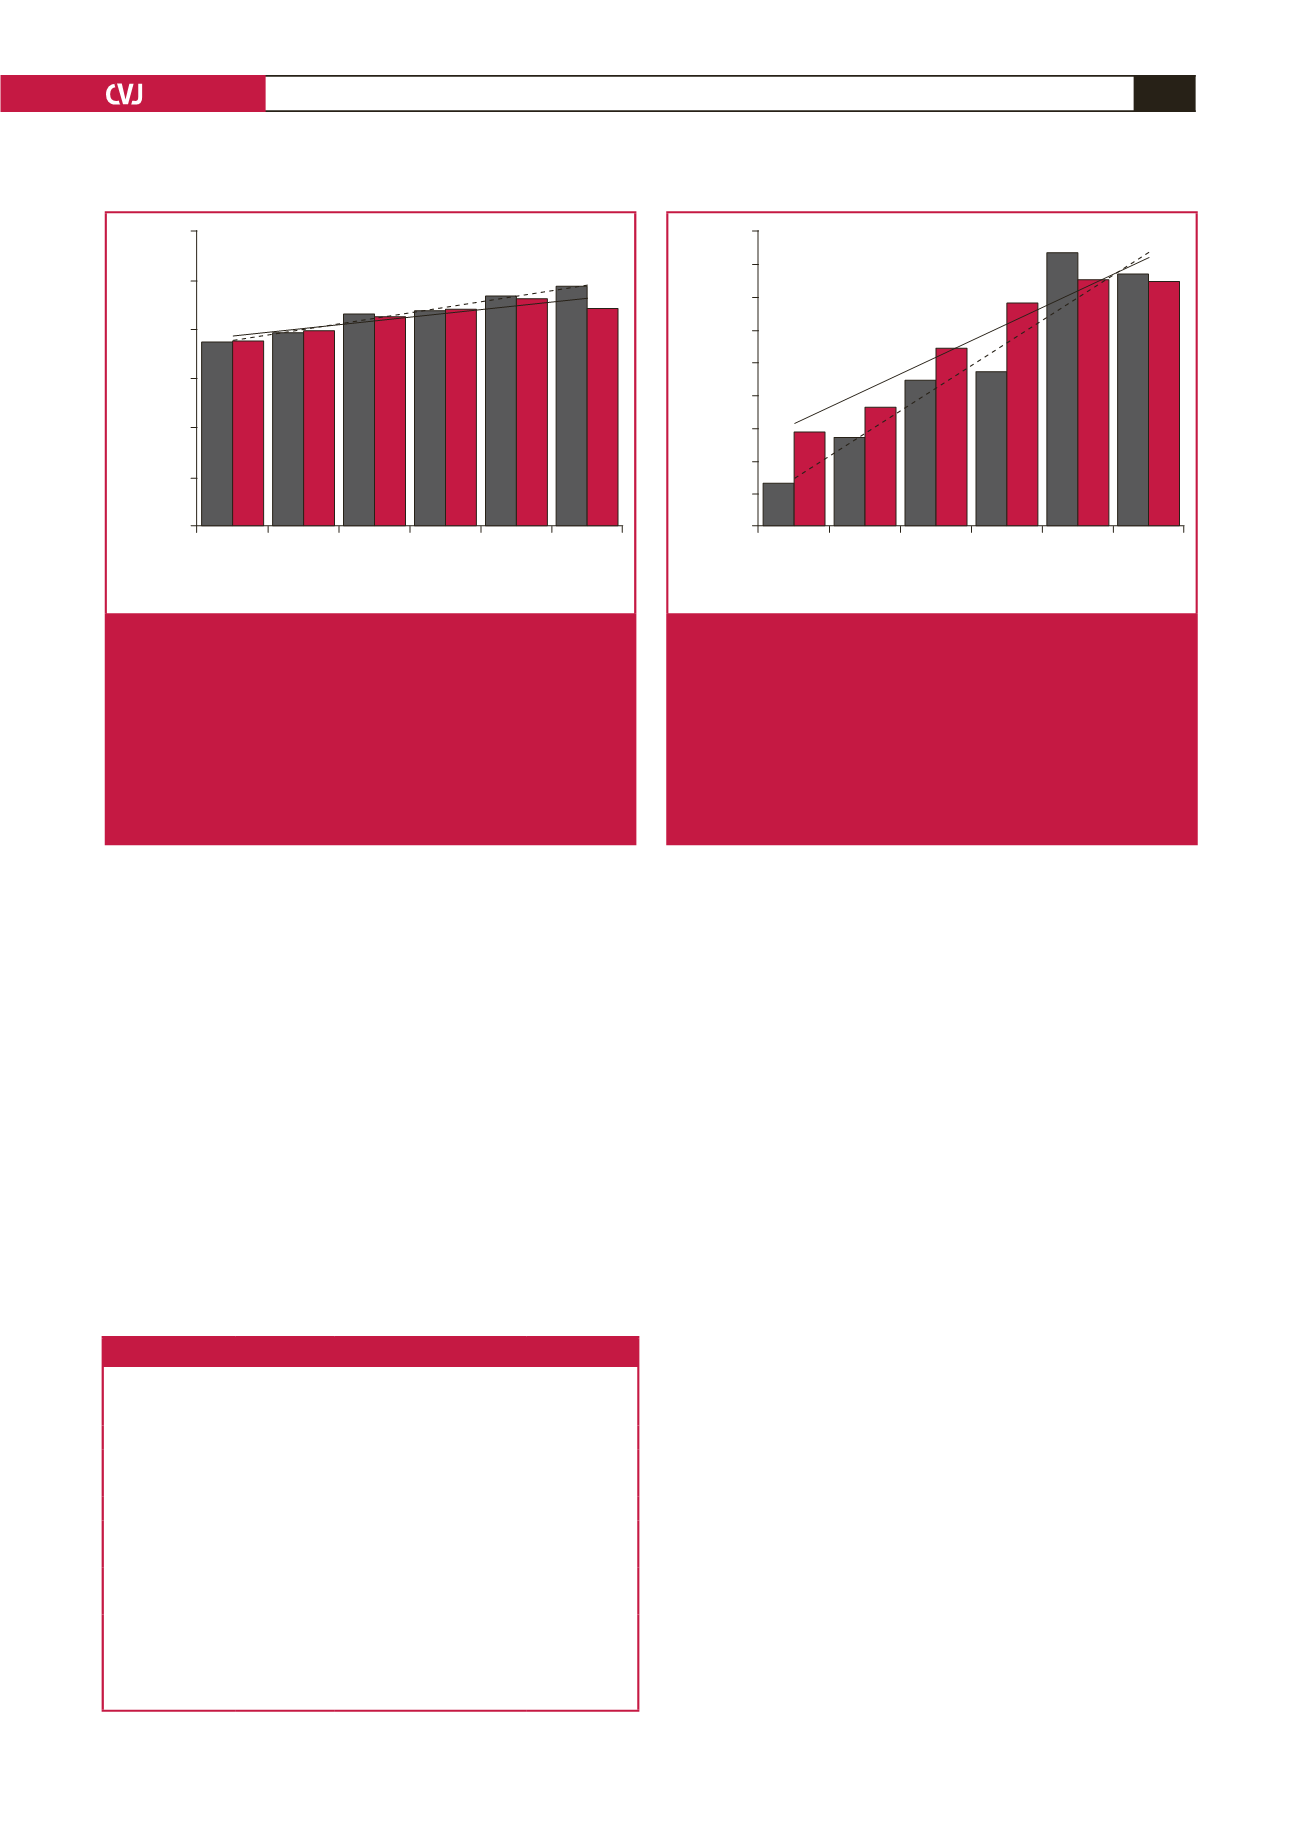
Fig. 5.
Mean DBP of patients with known age
≥
20 years in the
Gambia (2000) and Sierra Leone (2001). Histogram of
mean DBP
±
SD. The Gambia
=
grey bars and dashed
line, Sierra Leone
=
red bars and solid line. Regression
equations:
y
=
4.575
x
+
70.43 (
R
=
0.990) for the
Gambia and
y
=
3.078
x
+
74.07 (
R
=
0.906) for Sierra
Leone.
p
-values: Student’s
t
-test. *Wilcoxon rank-sum
test
p
-value. G
=
The Gambia, S
=
Sierra Leone, SD
=
standard deviation, DBP
=
diastolic blood pressure.
Table 4. Characteristics of patients with known age
≥
18 years in Sierra Leone
Data
collection
year
Gender N
SBP
(mmHg)
p-values
DBP
(mmHg) p-values
2001*
F 297 135.1
0.014, 0.003
83.0 0.35,
<
0.0001
M 362 131.7 0.73,
<
0.0001 81.3 0.41,
<
0.0001
2002**
F 304 130.1
<
0.0001,
<
0.0001 81.8
<
0.0001, 0.029
M 359 132.3
<
0.0001, 0.002 82.2
<
0.0001, 0.068
2003
†
F 209 141.8
0.84
92.6
0.0002
M 74 150.7
0.043
95.9
<
0.0001
2009
††
F 108 142.4
0.010
85.6
0.13
M 74 142.4
0.0009
85.5
0.022
Values: least squares means (LSmeans).
p
-values: *2001 vs 2002 and 2003, respectively, **2002 vs 2003 and 2009, respec-
tively,
†
2003 vs 2009,
††
2009 vs 2001.
F
=
females, M
=
males, SBP
=
systolic blood pressure, DBP
=
diastolic blood
pressure.
90
80
70
60
50
40
30
20
10
0
G S G S G S G S G S G S
20s 30s 40s 50s 60s
≥
70s
Age decade
Hypertension prevalence (%)
13.2
27.3
44.8
47.4
83.8
77.3
29.0
<
0.0001
0.11
0.26
0.015
0.43
>
0.99
36.5
54.7
68.3
75.5
75.0
Fig. 6.
HTN prevalence in patients with known age
≥
20
years in the Gambia (2000) and Sierra Leone (2001).
Histogram of HTN prevalence rates (%). The Gambia
=
grey bars and dashed line, Sierra Leone
=
red bars
and solid line. Regression equations:
y
=
14.07
x
–
0.293 (
R
=
0.957) for the Gambia and
y
=
10.30
x
+
20.44 (
R
=
0.963) for Sierra Leone.
p
-values: Fisher’s
exact test. HTN
=
hypertension. G
=
the Gambia, S
=
Sierra Leone.


