


 19 / 67

CARDIOVASCULAR JOURNAL OF AFRICA • Volume 26, No 2, March/April 2015
AFRICA
65
was amplified by polymerase chain reaction (PCR) using kapa
readymix (Kapa Biosystems Inc) using the GeneAmp
®
PCR
system 2700 (Applied Biosystems Inc) and products were
analysed on the ABI sequencer (Applied Biosystems Inc).
Genotyping data were scored using the ABI GeneMapper 3.0
software (Applied Biosystems Inc).
Results
Clinical features of the proband in pedigree 1
(individual 1.III.3)
A diagnosis of the same disease process was made in a proband
and three first-degree family members, namely the father and two
brothers of the proband, of whom one was asymptomatic (Fig.
1). While the proband and her two brothers had echocardiograms
typically associated with RCM, such as significant bi-atrial
dilatation (Table 2) in the presence of non-dilated ventricles with
preserved left ventricular systolic function, their presentations
differed. The proband, aged 27, had heart failure as evidenced by
dyspnoea, a raised jugular venous pressure, marked peripheral
oedema and gross hepatomegaly, but with a heart of normal
size clinically and on chest X-ray. The latter also showed
pulmonary congestion. An apical murmur consistent with mitral
regurgitation was present.
Despite management involving diuretics, other heart-
failure medication and anticoagulation, the disease progressed.
Atrial fibrillation ensued and heart failure worsened. Three
years after presentation the proband suffered an embolic ilio-
Table 2. Echocardiographic features of the four affected individuals (*), and the four close family members
who screened negative, as comparison
Measurement
*1.III.3
*1.III.1
*1.III.2
*2.III.3
2.III.2
2.III.1
2.II.8
2.II.7
Rhythm
Atrial flutter
SR Atrial fibrillation
SR
SR
SR
SR
SR
LA area (cm
2
)
31
31
32
34
15
15
18
18
RA area (cm
2
)
29
22
37
46
11
15
11
14
LVED (mm)
41
48
46
40
53
54
55
51
LVEF (%)
54
56
59
31
63
50
62
60
S
′
lat (cm/s)
3.6
9
8
4
11
11
11
7
RVED 4C (mm)
33
27
31
30
32
36
29
38
TAPSE (mm)
7
17
10
6
20
20
28
25
Max WT (mm)
14
13
10
21
7
7
8
8
Max WT (position)
LV apex Mid-LV septum RV free wall
Mid-LV septum –
–
–
–
Max RVH (mm)
13
nil
10
9
nil
nil
nil
nil
IVCm/ IVCs (mm/mm)
31/31
16/9
27/26
25/19
x
x
x
x
E (cm/s)
44
68
74
48
121
88
89
69
A (cm/s)
–
25
–
21
44
68
96
54
E/A
–
2.7
–
2.3
2.8
1.3
0.9
1.3
E–DT (ms)
96
111
135
105
209
210
217
207
e
′
lat (cm/s)
4
7
7.6
3.5
26
18
17
14
e
′
sep (cm/s)
3
x
x
2
x
x
x
x
E/e
′
lat
11
9.7
9.7
13.7
4.6
4.9
5.3
4.9
A: maximal transmitral A-wave velocity measured with pulsed-wave Doppler; E: maximal transmitral E-wave velocity with pulsed-wave Doppler;
E/A: ratio of E to A; E–DT: transmitral E-wave deceleration time in ms; E/e
′
lat: ratio of E wave to e
′
lat; e
′
lat: early diastolic pulsed-wave
tissue Doppler velocity measured at the lateral mitral valve annulus; e
′
sep: late diastolic (atrial contraction) pulsed-wave tissue Doppler velocity
measured at the septal mitral annulus; LA area: left atrial area; LV: left ventricular area; LVED: left ventricular end-diastolic dimension; LVEF: left
ventricular ejection fraction; IVCm/IVCs: the two numbers represent the maximal inferior vena cava diameter and the minimum inferior vena cava
diameter, respectively, after a sniff manoeuvre; Max RVH: where right ventricular hypertrophy is present, this denotes the maximal right ventricu-
lar wall thickness measurement; Max WT: maximal wall thickness measured in mm; Max WT position: describes the position of measurement of
maximal wall thickness; RA area: right atrial area; RV: right ventricular area; RVED 4C: basal right ventricular inflow dimension at end-diastole
as measured in the four-chamber view; S
′
lat: pulsed-wave tissue Doppler-derived lateral mitral annular systolic velocity; SR: sinus rhythm; TAPSE:
tricuspid annular-plane systolic excursion measured by m-mode; x: data not available; –: measurement not applicable.
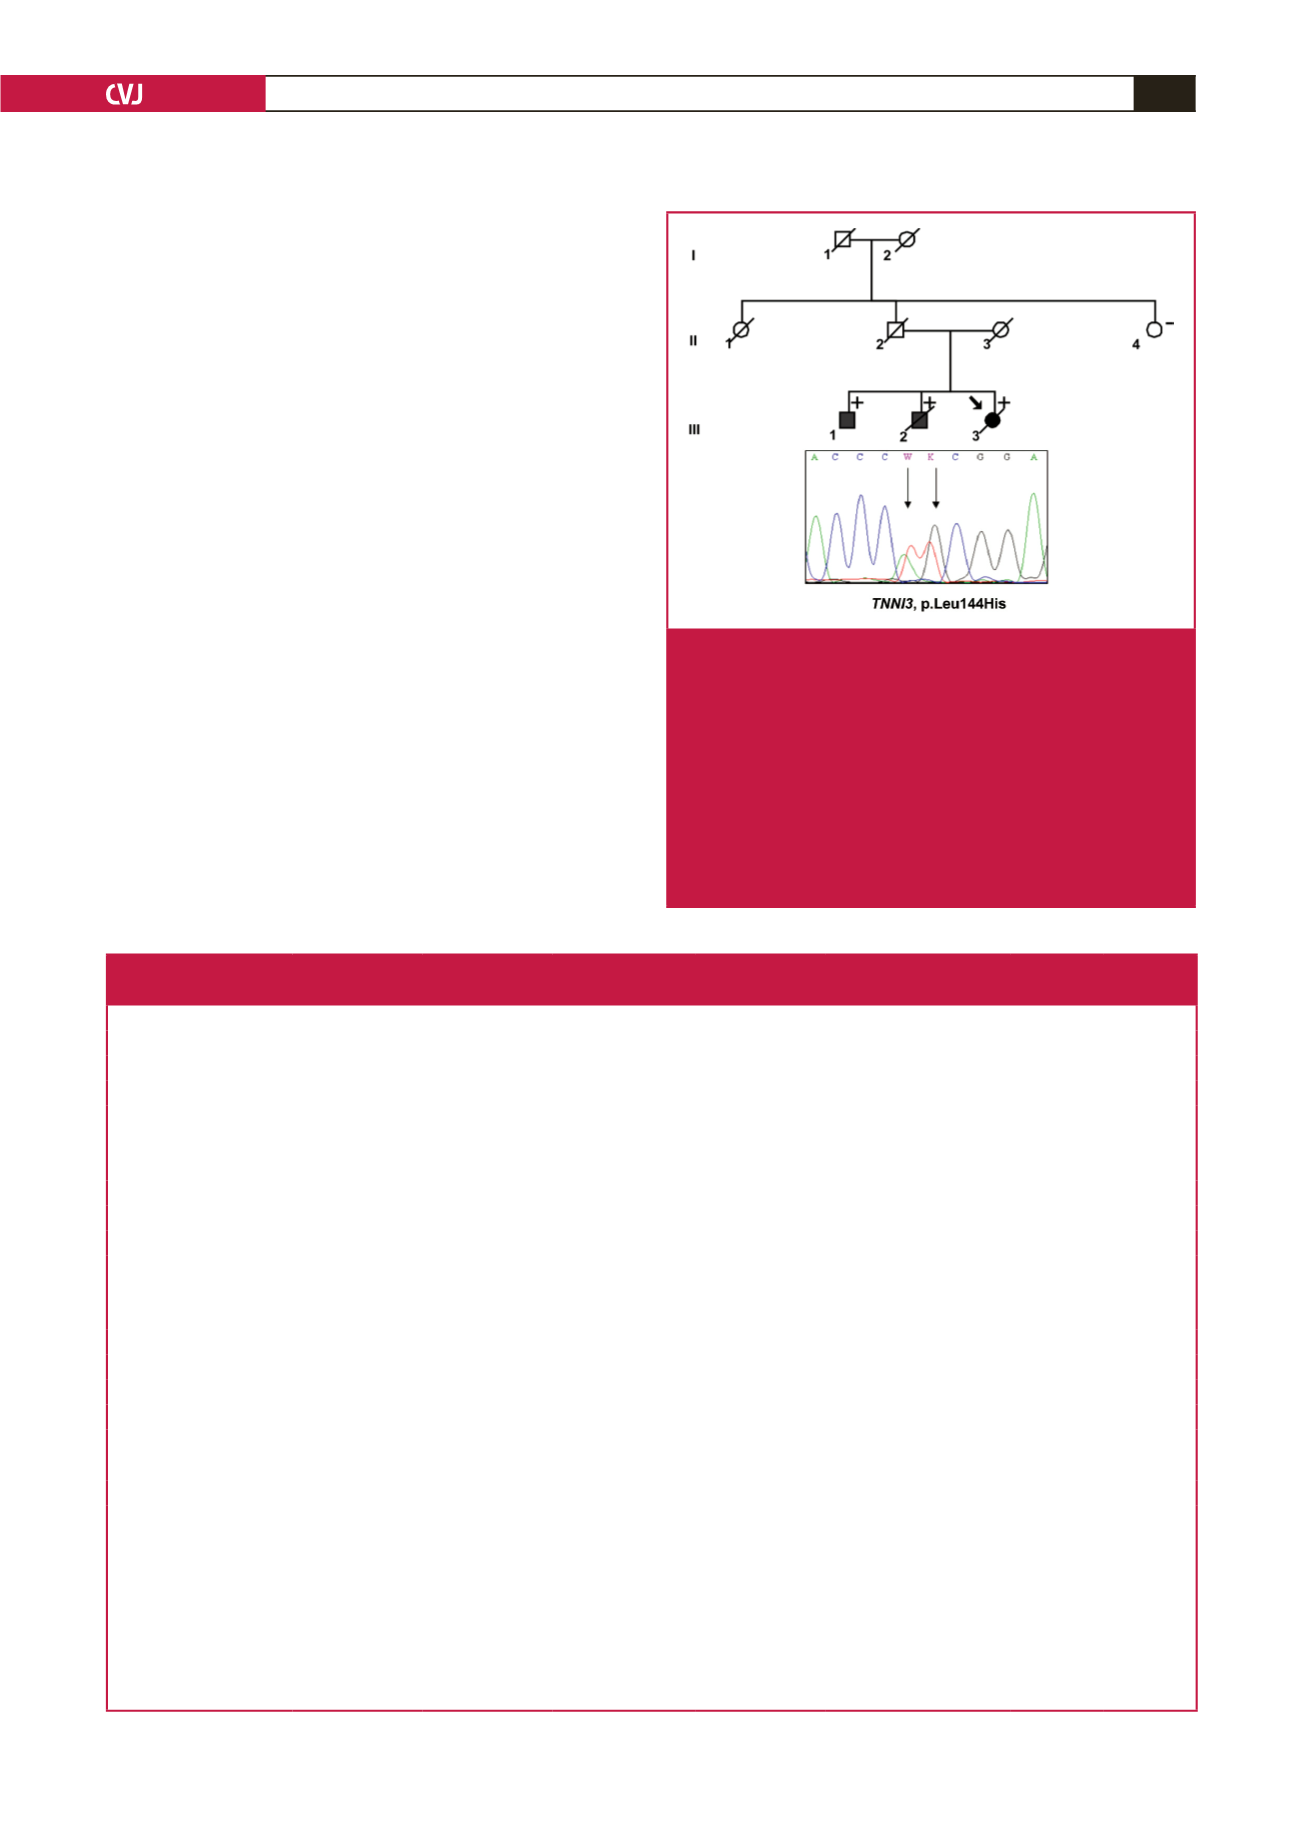
Fig. 1.
Diagram of the pedigree of the family carrying the famil-
ial HCM-causing p.Leu144His mutation (pedigree 1).
The arrow indicates the proband. Solid symbols indicate
documented affected individuals, open symbols indicate
unaffected individuals. Mutation carriers are indicated
by a
+
sign, and individuals without mutations are indi-
cated by a – sign. Slashed symbols indicate deceased
members. The arrows in the chromatogram indicate the
point of variation for the p.Leu144Gln (c.432T
>
A) muta-
tion and p.Leu144 (c.433G
>
T) variant, respectively, that
results in the novel p.Leu144His mutation.