


 21 / 67

CARDIOVASCULAR JOURNAL OF AFRICA • Volume 26, No 2, March/April 2015
AFRICA
67
pattern (transmitral pulse-wave E/A ratio of 2.7 and E-wave
deceleration time of 111 ms) supported by an E/e
′
lateral of
almost 10.
The distribution of hypertrophy in/between the family
members varied. The proband showed a focal area of significant
hypertrophy involving the left ventricular apex and mid- to
apical segments of the right ventricular free wall [maximal
wall thickness (MWT) 14 mm]. In the younger brother (1.III.2,
Fig. 1) the pattern of hypertrophy involved the right ventricle
exclusively. The mid- to basal right ventricular free wall
demonstrated significant focal hypertrophy of up to 10 mm,
causing the bulging right ventricular free wall to almost ‘kiss’
the interventricular septum in systole – associated with a small
intra-cavitary right ventricular gradient and prominent systolic
flow turbulence on colour Doppler. The elder brother of the
proband (1.III.1, Fig. 1) showed a focal area of hypertrophy
with a MWT of 13 mm at the mid-septal region associated with
mid-left ventricular cavity obliteration.
In pedigree 2, the proband (2.II.3, Fig. 3) was the only affected
person from the family and showed systolic impairment with
poor EF of 31%. In line with this, systolic left ventricular long-
axis function and right ventricular long-axis systolic function,
as assessed by a TAPSE of 6 mm, was severely impaired. Tissue
Doppler indices demonstrated an individual with severe left
ventricular diastolic early relaxation impairment and high filling
pressures, reflected by a restrictive transmitral filling pattern
(E/A; E-wave deceleration time and E/e
′
lateral measuring
>
13) (Table 2). Significantly more hypertrophy was observed in
the MWT (21 mm) and mid-right ventricular free wall (9 mm).
Furthermore, the right heart flow was sluggish as highlighted
by marked spontaneous echo contrast present in both the right
atrium and right ventricle.
Molecular analysis
Molecular analysis of the cohort identified 14 genetic variants,
of which six were exonic variants and eight were intronic variants
(Table 3). In total, four novel variants were identified, of which
one was an exonic variant (p.Leu144His) and three were intronic
variants (c. –47C
>
T, c.109–17C
>
A, c.*35C
>
T). The remaining
variants have previously been documented, and all exonic
variants that resulted in an amino acid change (p.Pro82Ser,
9,10
p.Arg162Gln
9,11,12
p.Arg170Gln
11
) were tested for by restriction
enzyme analysis in available family members.
The mutation found in pedigree 1 (p.Leu144His) is novel, and
together with the exonic variant (p.Arg170Gln) found in pedigree
2, have not been observed in the South African population
before; these will be discussed in more detail. The remaining two
identified exonic variants, namely p.Arg162Gln and p.Pro82Ser,
were observed in two patients diagnosed with HCM. One patient
presented with symptoms of atrial fibrillation (male, 61 years)
and the other, an unexpected death, was diagnosed post mortem
(male, 41 years, ventricular hypertrophy). Both mutations had
previously been associated with HCM. Other family members
were either unaffected by HCM or not available for further
testing.
Identification of a novel cardiac troponin I gene
mutation
A
Bcc
I restriction enzyme digest was performed to confirm the
presence of the p.Leu144His mutation in the three siblings in
pedigree 1. Furthermore, this mutation was absent in a healthy,
Table 3. List of genetic variants identified in
TNNI3
Fragment
Sequence v
ariants
Amino acid
effect
Documented
Exon 1
c.-148A
>
G None
rs73935313
c.-47C
>
T
None
Novel
c.-35C
>
A None
rs3729707
Exon 2
c.25-8T
>
A None
rs3729836
c.108
+
21G
>
A None
rs3729837
Exon 4
c.109-17C
>
A None
Novel
c.150
+
13G
>
A None
rs73617692
Exon 5
c.198G
>
A p.Glu66
rs3729710
c.204G
>
T p.Arg68
rs3729711
c.244C
>
T p.Pro82Ser
rs77615401
Exon 7
c.432TG
>
AT p.Leu144His
*
Novel
c.485G
>
A p.Arg162Gln Previously described
12,14,15
c.509G
>
A p.Arg170Gln Previously described
16
Exon 8
c.*35C
>
T None
Novel
Arg: arginine; Glu: glutamine; His: histadine; Leu: leucine;
TNNI3
:
cardiac troponin I; Pro: proline.
*Novel mutation caused by two adjacent sequence changes; c.432T
>
A
(synonymous), which has been reported before,
5
and a novel
c.433G
>
T (non-synonymous) variant.
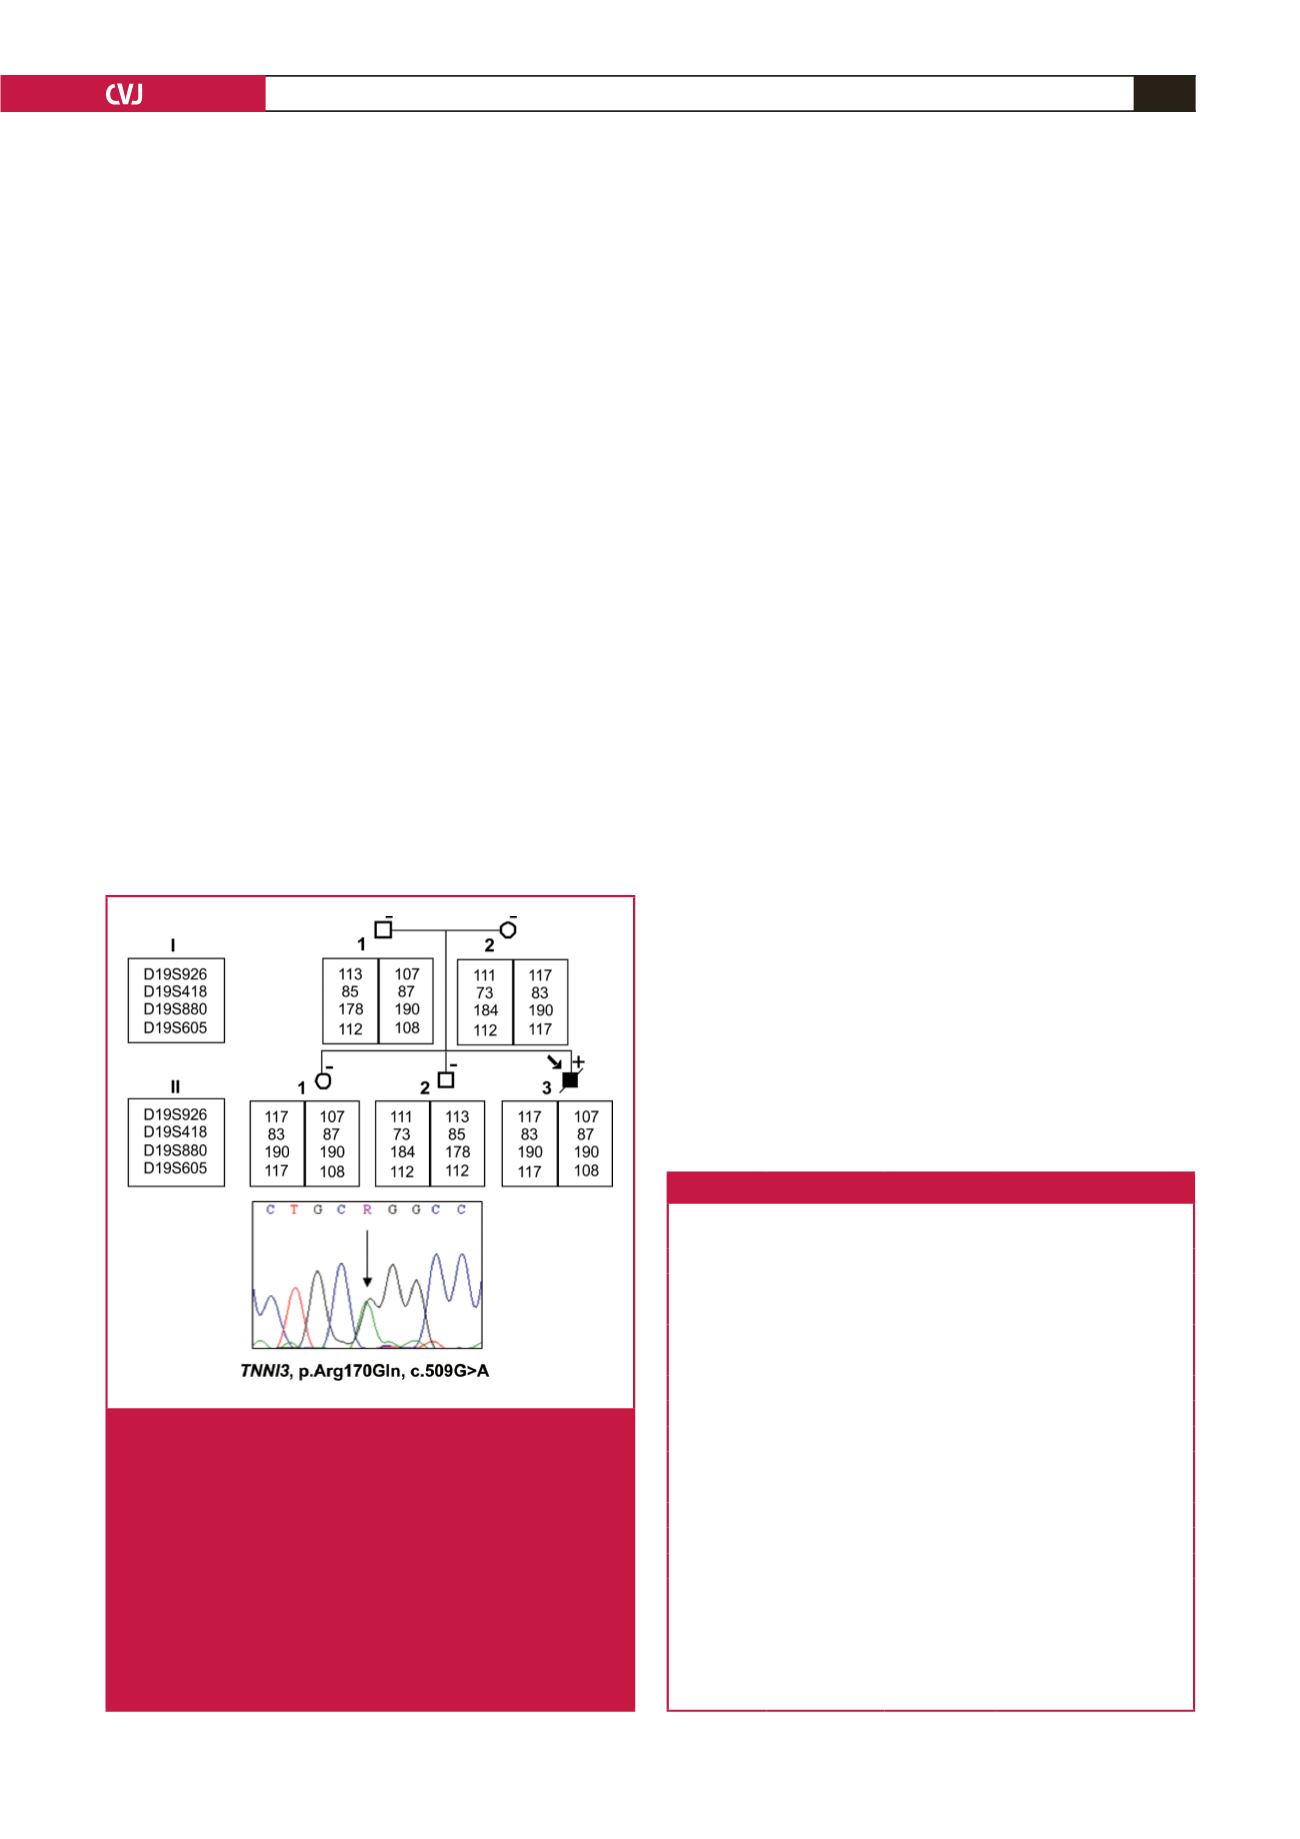
Fig. 3.
Diagram of the pedigree of the family carrying the
familial HCM-causing p.Arg170Gln mutation (pedi-
gree 2). The arrow indicates the proband. Solid
symbols indicate documented affected individuals,
open symbols indicate unaffected individuals. The
mutation carrier is indicated by
+
sign, and individuals
without mutations are indicated by a – sign. Slashed
symbols indicate deceased members. The arrow in the
chromatogram indicate the point of variation for the
p.Arg170Gln (c.509G
>
A) mutation. Individual alleles
of four microsatellite markers (D19S926, D19S418,
D19S880, D19S605) are shown for pedigree 2.