


 38 / 68

CARDIOVASCULAR JOURNAL OF AFRICA • Volume 26, No 3, May/June 2015
136
AFRICA
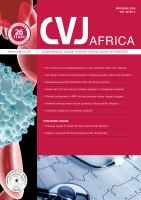
rates of the rats in each group in each time period. The changes
in the heart rates in the amitriptyline-treated groups (groups 1, 2
and 3) and the control group are shown in Fig. 1.
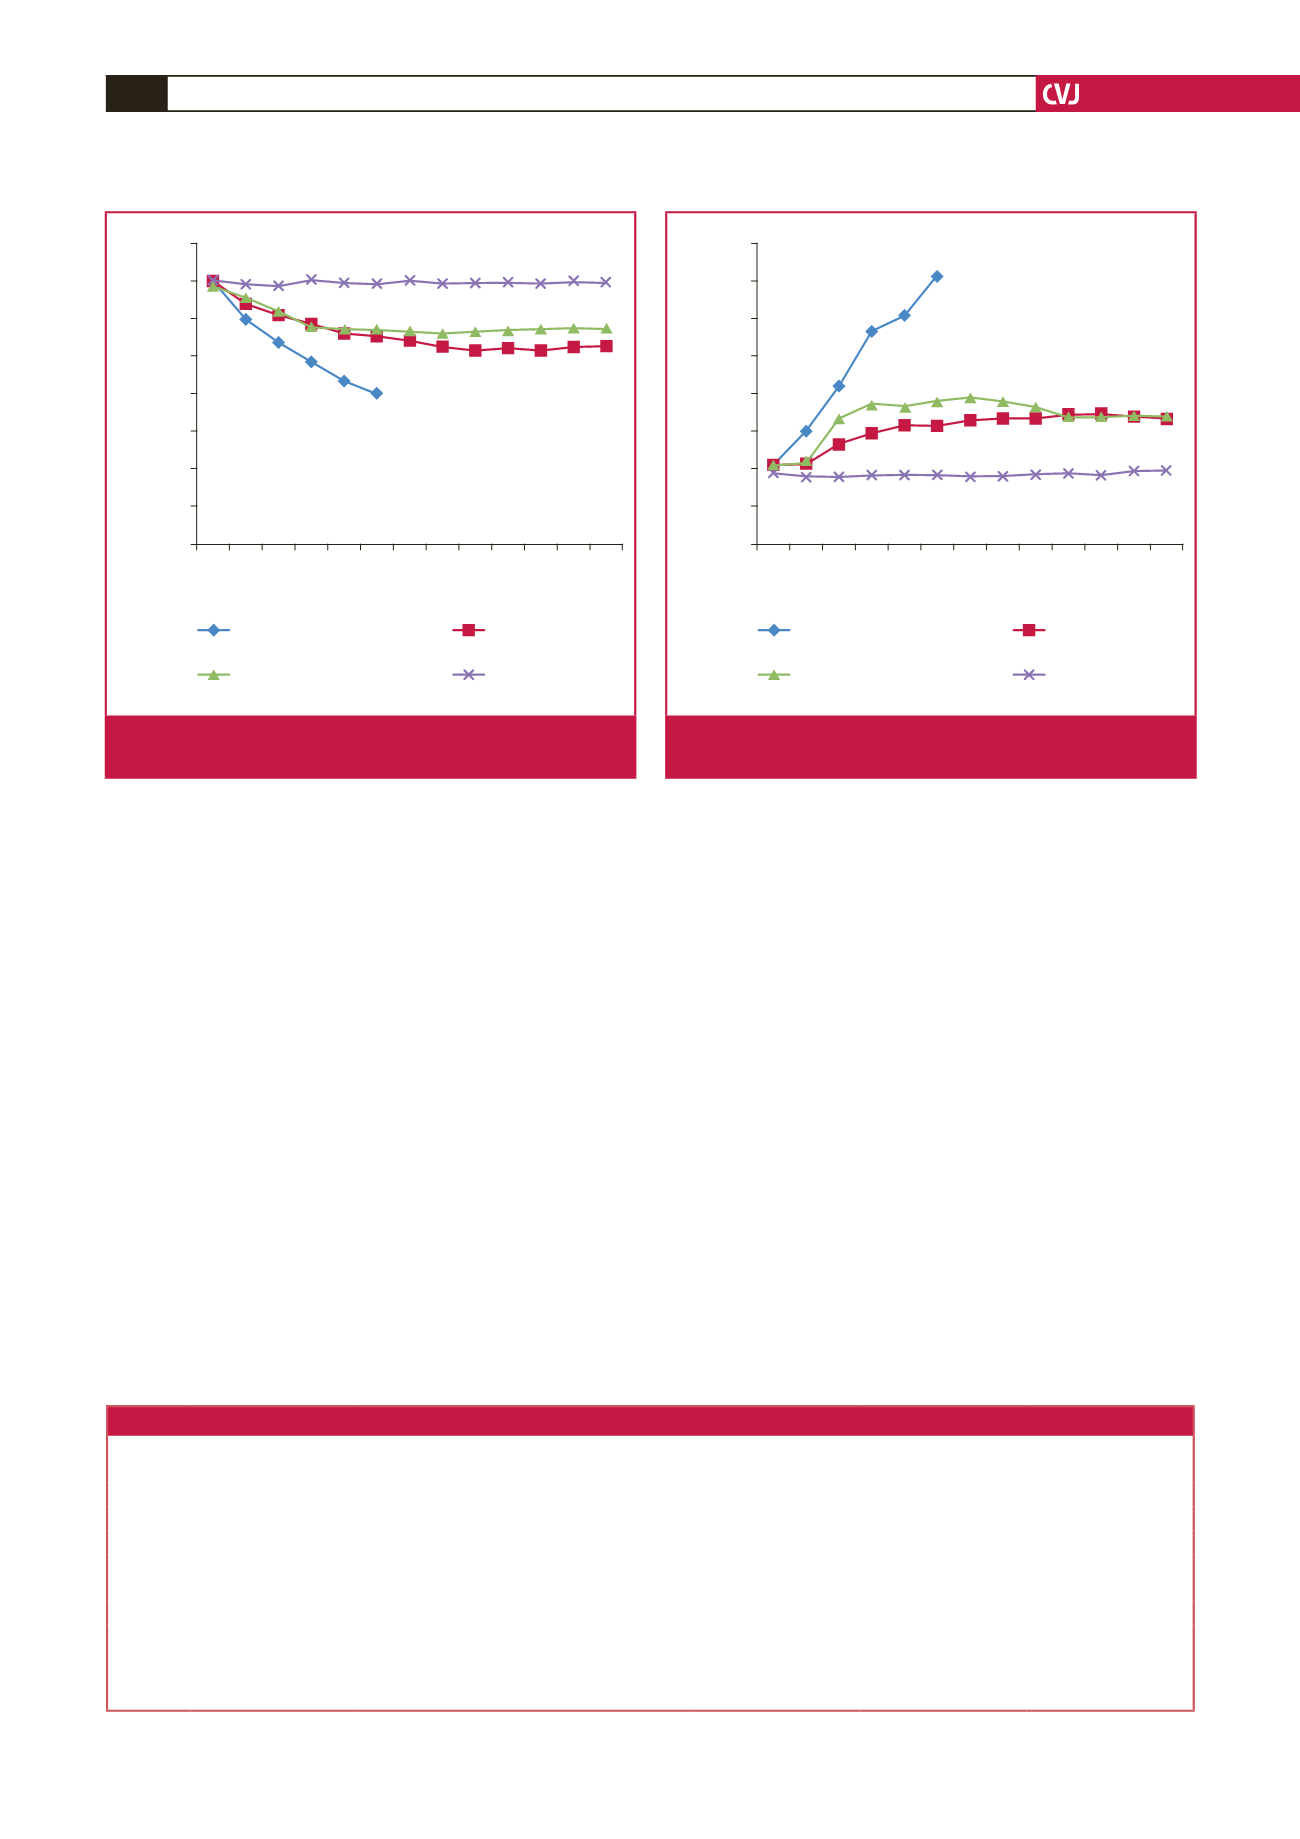
The baseline QRS durations were similar among groups.
The changes in the QRS durations in the groups that did not
received amitriptyline (groups 4, 5 and 6) were non-significant,
whereas the amitriptyline-administered groups (groups 1, 2 and
3) showed a statistically significant increase in the QRS duration.
This increase was more marked in group 1. The increase in QRS
duration was limited in the groups that received amitriptyline
with HS or NaHCO
3
(groups 2 and 3). There was no statistically
significant difference between these groups in terms of increase
in the duration of the QRS. A comparison of the QRS duration
in each group in each time period is shown in Table 3, and a
comparison of the change in QRS duration of the amitriptyline-
treated groups (groups 1, 2 and 3) and control group is shown
in Fig. 2.
The baseline QTc durations were similar among the groups.
There was no significant change in the QTc durations in the
groups that did not receive amitriptyline (groups 4, 5 and 6).
The QTc duration increased in the amitriptyline-treated groups
(groups 1, 2 and 3), but the increase was more marked in group
1. The increase in the QTc duration was reduced in the groups
administered HS or NaHCO
3
with amitriptyline. There was no
statistically significant difference between the two groups (groups
2 and 3) in terms of QTc prolongation. A comparison of the QTc
duration of the groups in each time period is shown in Table 4,
and a comparison of the change in duration of the QTc in the
amitriptyline-treated groups and the control group is shown in
Fig. 3.
Serum samples for sodium and ionised calcium analyses
were taken from the surviving rats at the 60th minute and from
the non-survivors immediately after death. In the groups that
received amitriptyline (groups 1, 2 and 3), the serum sodium
levels had decreased. This decline was most evident in group
1, which did not receive any sodium-containing treatment.
Hyponatraemia was more pronounced in group 2 than group 3.
No subject developed hypernatraemia.
The serum ionised calcium levels were higher in the groups
that received amitriptyline and highest in the amitriptyline-only
group (group 1). The distribution of the serum levels of ionised
calcium and sodium in the groups is shown in Table 5. The serum
sodium levels showed a strong positive correlation with heart
rates, a strong negative correlation with QRS duration, and a
Table 3. QRS changes with time according to group
Group
Start
5th minute
10th minute
15th minute
20th minute
25th minute
1
0.210
±
0.001
*
0.0303
±
0.0015
c,e
0.042
±
0.01
a,c,d,e
0.057
±
0.014
a,b,c,d,e
0.061
±
0.130
a,b,c,d,e
0.072
±
0.02
a,b,c,d,e
2
0.208
±
0.001
*
0.022
±
0.010
*
0.027
±
0.006
a
0.030
±
0.005
a
0.032
±
0.006
a,g,i
0.032
±
0.006
a,i
3
0.208
±
0.003
*
0.022
±
0.002
*
0.034
±
0.008
j,k,l
0.038
±
0.008
b,k,l
0.037
±
0.008
b,j,k,
l
0.038
±
0.009
b,j,k,l
4
0.198
±
0.001
*
0.0190
±
0.001
c
0.020
±
0.001
c,j
0.020
±
0.001
c
0.019
±
0.001
c,g,j
0.020
±
0.001
c,j
5
0.202
±
0.001
*
0.020
±
0.001
*
0.020
±
0.002
d,k
0.020
±
0.01
d
0.021
±
0.001
d,k
0.020
±
0.001
d,k
6
0.195
±
0.003
*
0.0183
±
0.02
e
0.018
±
0.001
e,l
0.019
±
0.002
e,k,l
0.019
±
0.001
e,i,l
0.019
±
0.001
e,i,l
Mean
0.204
±
0.002
0.022
±
0.007
0.027
±
0.01
0.030
±
0.015
0.031
±
0.016
0.031
±
0.018
p
-value
0.782
0.032
0.000
0.000
0.000
0.001
*
The group with no difference from the others,
p
<
0.05 (
a
compared with groups 1 and 2,
b
compared with groups 1 and 3,
c
compared with groups 1 and 4,
d
compared
with groups 1 and 5,
e
compared with groups 1 and 6,
f
compared with groups 2 and 3,
g
compared with groups 2 and 4,
h
compared with groups 2 and 5,
i
compared with
groups 2 and 6,
j
compared with groups 3 and 4,
k
compared with groups 3 and 5,
l
compared with groups 3 and 6).
400
350
300
250
200
150
100
50
0
0 5 10 15 20 25 30 35 40 45 50 55 60
Duration (minutes)
Heart rate (beats/minute)
Only amitriptyline
Amitriptyline +
hypertonic saline
Amitriptyline +
sodium bicarbonate
Control
Fig. 1.
Heart rate changes of the amitriptyline-administered
groups and control group with time.
0.080
0.070
0.060
0.050
0.040
0.030
0.020
0.010
0.000
0 5 10 15 20 25 30 35 40 45 50 55 60
Duration (minutes)
QRS interval (seconds)
Only amitriptyline
Amitriptyline +
hypertonic saline
Amitriptyline +
sodium bicarbonate
Control
Fig. 2.
QRS changes of the amitriptyline-administered groups
and control group with time.