


 39 / 68

CARDIOVASCULAR JOURNAL OF AFRICA • Volume 26, No 3, May/June 2015
AFRICA
137
significant moderately negative correlation with QTc duration.
Serum ionised calcium levels exhibited a significant moderately
negative correlation with heart rate and a significant moderately
positive correlation with QRS and QTc duration (Table 6).
Discussion
The results of this experimental study suggest that administration
of HS or NaHCO
3
before toxicity occurs may reduce the
development of cardiac toxicity in amitriptyline poisoning.
Overdose of TCAs, including amitriptyline, are a major
causes of drug-related deaths all over the world.
10
Amitriptyline
poisoning primarily affects the cardiovascular and neurological
systems.
1,11,12
It causes toxicity by blocking the voltage-gated
sodium channels, which facilitate the fast flow of sodium
into the cells.
1,13
Anticholinergic and
α
-adrenergic blockage
also contribute to this.
1,3,13,14
Blockage of cardiac sodium and
potassium channels may result in cardiac conduction delay,
dysrhythmia and hypotension due to myocardial depression.
1,2,4,14
This process may appear on the ECG as prolonged PR, QRS
and QT times, sinus tachycardia, and supraventricular and
ventricular arrhythmias.
1,11
The most important cause of death is
persistent hypotension resulting from myocardial depression due
to arrhythmias.
3,5,10,12,13
The majority of patients who take toxic doses of amitriptyline
enter a coma, but a minority develop life-threatening
complications. Others often recover with supportive care, without
subsequent problems.
15,16
Despite defined scoring systems such as
the Antidepressant Overdose Risk Assessment (ADORA),
17
it is often difficult to distinguish these two groups of patients.
In addition, the correlation between serum drug levels and
clinical outcome is weak, and routine drug level analyses are not
recommended.
18,19
Various methods have been used to treat patients with
severe cardiotoxicity due to amitriptyline overdose. These
include serum alkalinisation with hypertonic NaHCO
3
20
or
hyperventilation,
21
inotropic agents,
4,22
magnesium sulphate,
5
anti-arrhythmic drugs,
2,14
glucagon
12
haemoperfusion,
23,24
or
lipid emulsion.
25
Although many studies have compared these
treatment methods, no treatment has been shown to prevent
or reduce the toxicity in patients who may potentially develop
severe toxicity.
Table 6. Correlation between heart rate, QRS and QTc intervals
and serum sodium and calcium levels
Levels
Rate
QRS duration
QTc duration
Sodium
p
0.000
0.000
0.000
r
0.794**
–0.776**
–0.612**
Calcium
p
0.000
0.002
0.016
r
–0.0620*
0.500**
0.399*
*Correlation significant at the 0.05 level.
**Correlation significant at the 0.01 level.
Table 5. Distribution of serum levels of ionised calcium
and sodium according to group
Group
Sodium
Calcium
1
111.2
±
4.3
a
4.14
±
0.4
a
2
121.2
±
6.2
a
4.19
±
0.4
a
3
133.4
±
10.9
a
4.15
±
1.0
a
4
143.5
±
3.4
b
2.85
±
0.6
b
5
145.7
±
4.7
b
2.52
±
0.7
b
6
147.8
±
4.6
b
1.83
±
0.7
b
Mean
133.8
±
14.9
3.28
±
1.1
p
-value
0.000
0.000
a
No statically significant differences among groups 1, 2 and 3.
b
No statically significant differences among groups 4, 5 and 6.
Table 4. QTc changes with time according to group
Group
Start
5th minute
10th minute
15th minute
20th minute
25th minute
1
0.119
±
0.005
*
0.115
±
0.007
*
0.154
±
0.019
a,c,d,e
0.187
±
0.025
a,b,c,d,e
0.255
±
0.11
a,b,c,d,e
0.277
±
0.081
a,b,c,d,e
2
0.118
±
0.005
*
0.115
±
0.009
*
0.119
±
0.004
a,f
0.124
±
0.021
a
0.124
±
0.02
a
0.129
±
0.020
a
3
0.119
±
0.006
*
0.124
±
0.009
*
0.143
±
0.016
f,j,k,l
0.150
±
0.018
b,l
0.146
±
0.02
b
0.149
±
0.021
b
4
0.121
±
0.006
*
0.123
±
0.007
*
0.123
±
0.007
c,j
0.127
±
0.07
c
0.124
±
0.005
c
0.123
±
0.008
c
5
0.120
±
0.002
*
0.119
±
0.005
*
0.119
±
0.004
d,k
0.123
±
0.005
d
0.119
±
0.004
d
0.122
±
0.005
d
6
0.117
±
0.006
*
0.111
±
0.009
*
0.113
±
0.007
e,l
0.117
±
0.007
e,l
0.118
±
0.001
e
0.119
±
0.008
e
Mean
0.119
±
0.006
0.118
±
0.009
0.128
±
0.180
0.138
±
0.03
0.148
±
0.065
0.146
±
0.057
p
-value
0.654
0.0055
0.000
0.000
0.000
0.000
*
The group with no difference from the others,
p
<
0.05 (
a
compared with groups 1 and 2,
b
compared with groups 1 and 3,
c
compared with groups 1 and 4,
d
compared
with groups 1 and 5,
e
compared with groups 1 and 6,
f
compared with groups 2 and 3,
g
compared with groups 2 and 4,
h
compared with groups 2 and 5,
i
compared with
groups 2 and 6,
j
compared with groups 3 and 4,
k
compared with groups 3 and 5,
l
compared with groups 3 and 6).
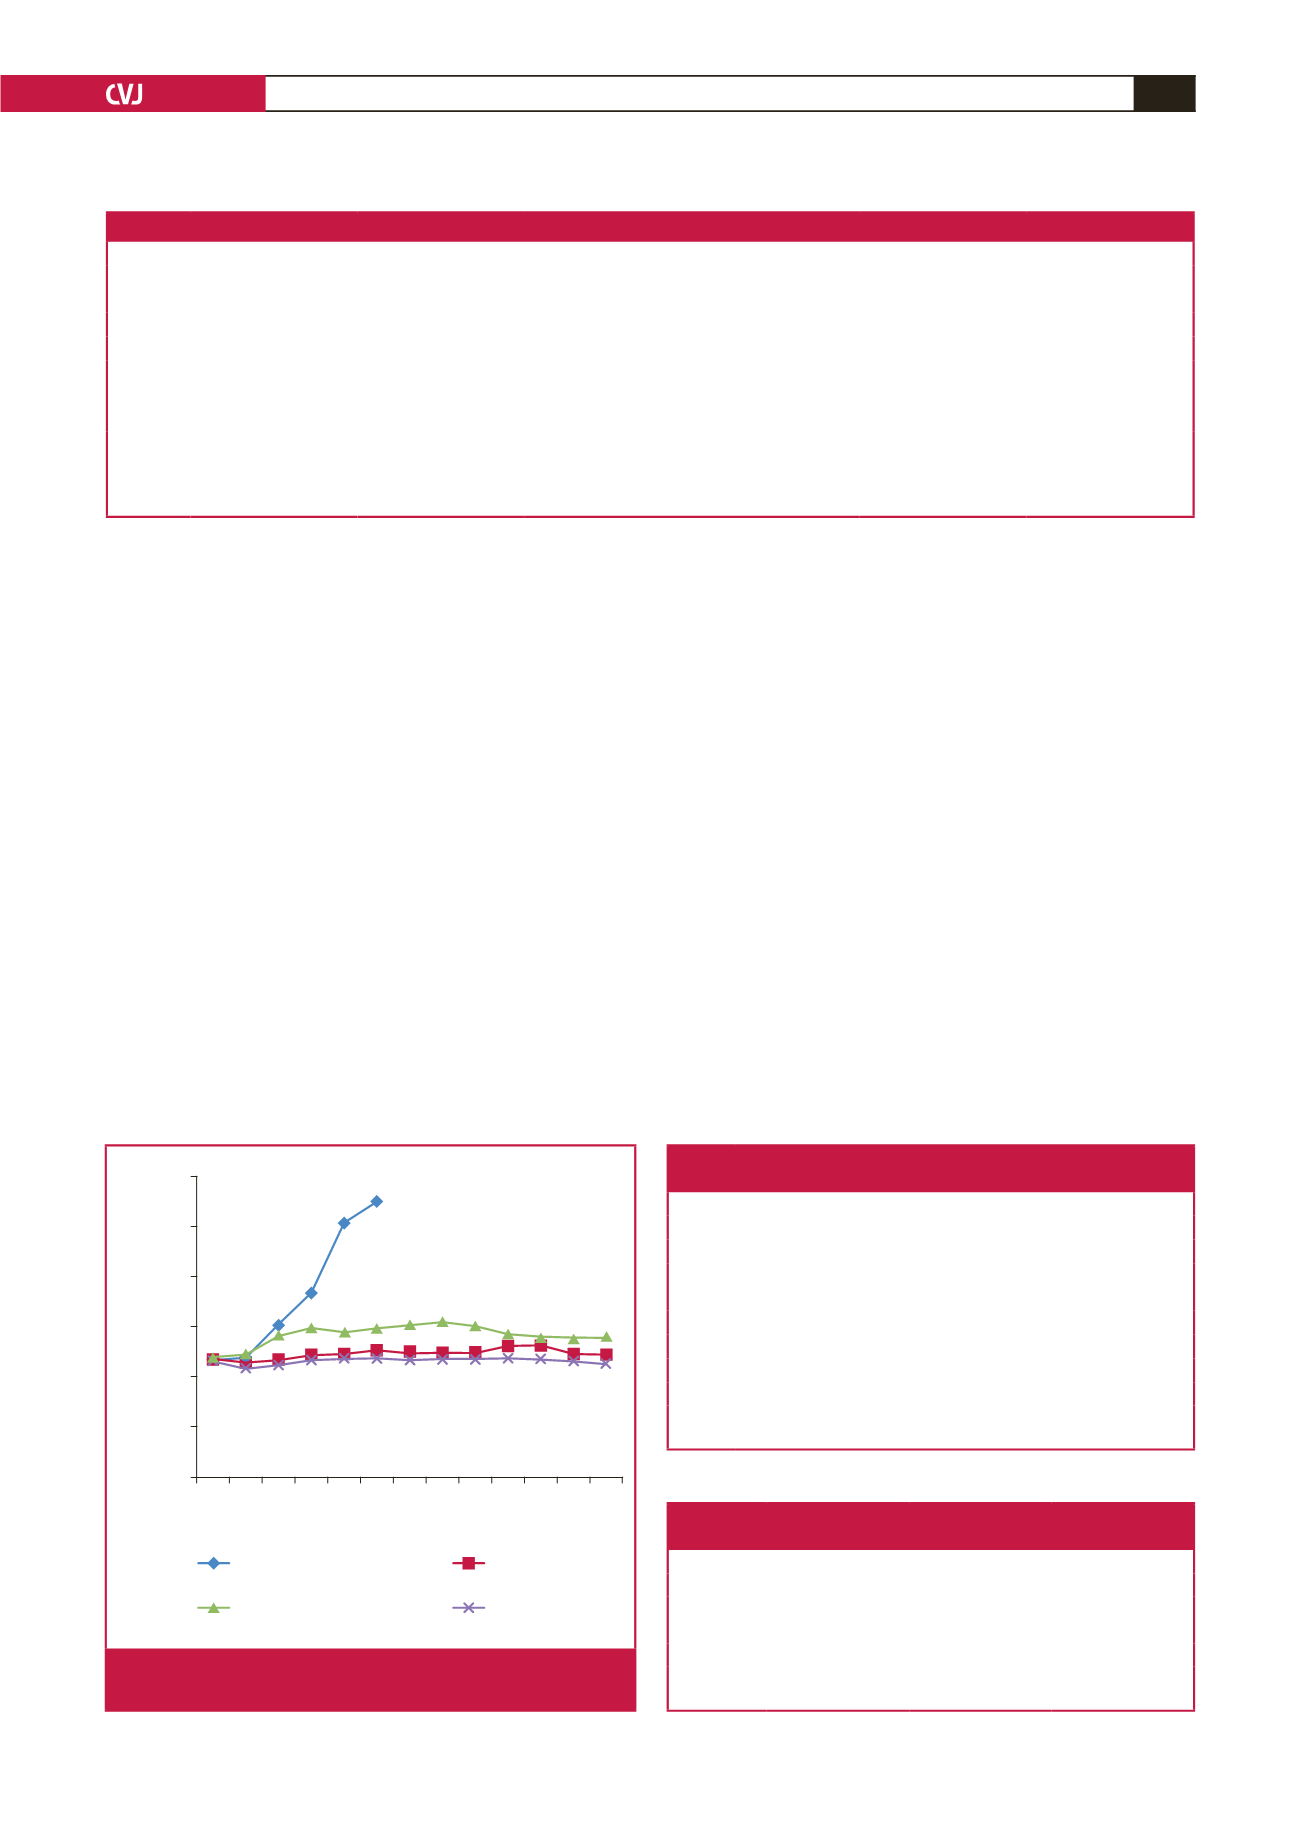
0.300
0.250
0.200
0.150
0.100
0.050
0.000
0 5 10 15 20 25 30 35 40 45 50 55 60
Duration (minutes)
QTc interval (seconds)
Only amitriptyline
Amitriptyline +
hypertonic saline
Amitriptyline +
sodium bicarbonate
Control
Fig. 3.
QTc changes of the amitriptyline-administered groups
and control group with time.