


 52 / 68

CARDIOVASCULAR JOURNAL OF AFRICA • Volume 26, No 3, May/June 2015
e2
AFRICA
blood pressure of 112/82 mmHg. A few moist crackles were
apparent in the patient’s lungs.
Laboratory studies revealed a white blood cell count of
23.02
×
10
9
cells/l with 88.6% neutrophils, and the following
blood levels: alanine aminotransferase (ALT), 233 U/l (range
0–40); creatinine (Cr), 243.1 µmol/l (range 44–133); creatine
kinase (CK), 36 762 U/l (range 26–174); plasma glucose, 49.1
mmol/l; fasting C-peptide, 0.01 ng/ml (range 0.7–1.9); two-hour
postprandial C-peptide, 0.15 ng/ml; glycosylated haemoglobin
(HbA
1c
), 8.4%; and C-reactive protein (CRP), 33.7 mg/l (range
0–5). The patient’s creatine kinase-MB (CK-MB) concentration
was
>
500 ng/ml, and his troponin I concentration was
>
180 ng/
ml. Arterial blood gas analysis results showed the following: pH,
7.299; PO
2
, 16.80 kPa; PCO
2
, 4.01 kPa; base excess (BE), –10.8
mmol/l.
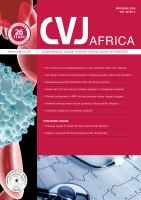
A chest X-ray revealed a pneumonia infection of the lower
right lung. An ECG showed ST-segment elevation in leads II,
III, aVF and V7–V9 (Fig. 1A, B). Echocardiography revealed
decreased left ventricular systolic function (ejection fraction:
32%) with left ventricular inferior and posterior wall motion
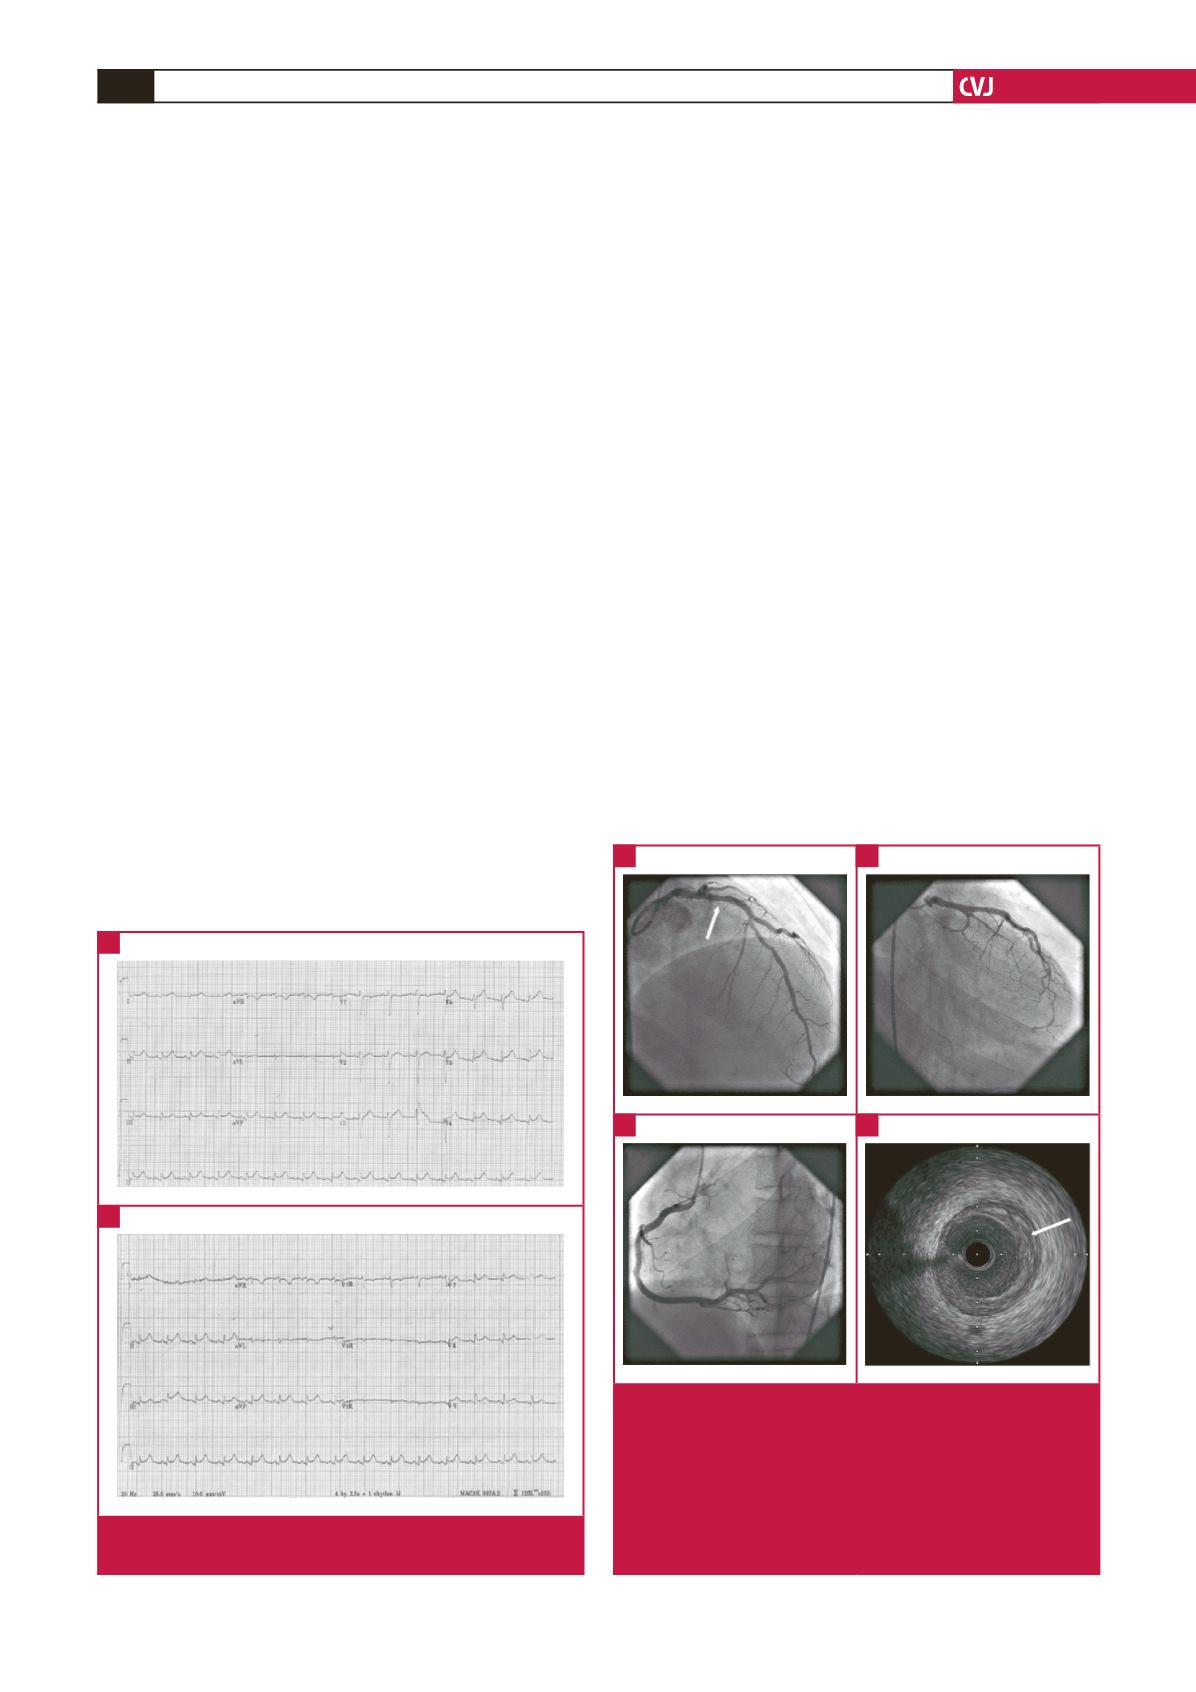
abnormalities. Coronary angiography indicated no luminal
narrowing in the left main coronary artery, circumflex or right
coronary arteries, although atherosclerosis was apparent in
the left anterior descending artery, with stenosis of 30% (Fig.
2A–C). Intravascular ultrasound results showed a local plaque
load of 43% in the middle of the anterior descending artery,
with a minimum vessel lumen area of 7.34 mm
2
(Fig. 2D). Thus,
myocardial infarction induced by coronary atherosclerosis and
plaque rupture was excluded.
From the above findings, the patient was diagnosed with
SIRS and MODS, which included acute inferior and posterior
wall myocardial infarction with acute heart failure, fulminant
diabetes, acute liver dysfunction, acute kidney dysfunction
and rhabdomyolysis. The patient received a series of powerful
treatments, including insulin intravenous infusion, antiplatelet
therapy and anticoagulation therapy with aspirin, clopidogrel
and low-molecular-weight heparin, diuretics, urine alkalisation,
and anti-inflammatory antibiotic therapy.
The patient’s condition improved after treatment for one
week; each organ regained normal function and the patient was
discharged in a good clinical state after a total hospitalisation
of 14 days. The follow-up visit in out-patient service one month
after discharge showed that the patient’s blood test, ECG and
echocardiography results were all normal.
Discussion
Studies have shown that SIRSmay produce stress hyperglycaemia,
which has possible detrimental effects on the prognosis of
patients.
5
Elevated blood glucose levels may also predict mortality
and length of intensive care unit (ICU) and hospital stay for
trauma patients, and have been associated with infectious
morbidity and prolonged need for mechanical ventilation.
6,7
A
strong link has been described between elevated blood glucose
levels and the risk of critical illness in sepsis and SIRS.
8
So, for
this patient, whose blood glucose was reported out of range
at 49.1 mmol/l, early active glycaemic control was extremely
important. Two large randomised, controlled clinical trials
Fig. 1.
An electrocardiogram showing ST-segment elevation in
leads II, III and aVF (A), and in leads V7–V9 (B).
A
B
Fig. 2.
Results of coronary artery angiography and an intra-
vascular ultrasound. (A) the arrow indicates the presence of
atherosclerosis, with a 30% stenosis in the middle of the left
anterior descending artery. (B) and (C) normal blood flow in
the circumflex and right coronary arteries. (D) the arrow indi-
cates a local plaque load of 43% in the middle of the anterior
descending artery and a minimum vessel lumen area of 7.34
mm
2
, as revealed by an intravascular ultrasound.
A
C
B
D