
CARDIOVASCULAR JOURNAL OF AFRICA • Volume 26, No 6, November/December 2015
AFRICA
237
When the cardiac marker values in arterial and coronary
sinus blood samples were compared, significant differences
were found between the pre-ACC and post-ACC periods (Table
2). On the other hand, when net release of cardiac markers
was compared, significant differences were found between the
pre-ACC and post-ACC periods for CK-MB, CK-MB mass,
cTnI and hs-cTnT (Table 3).
A significant positive correlation was observed between
apoptotic index and arterial blood CK-MB mass, cTnI and
hs-cTnT values in the post-ACC period. A positive correlation
was observed between the apoptotic index and coronary sinus
blood CK-MB mass, cTnI and hs-cTnT values in the post-ACC
period. No correlation was found between apoptotic index and
arterial and coronary sinus blood CK-MB values (Table 4).
A significant positive correlation was observed between
myocardial injury score and arterial blood cTnI and hs-cTnT
values in the post-ACC period. In addition, a positive correlation
was found between myocardial injury score and coronary sinus
blood cTnI and hs-cTnT values in the post-ACC period. No
correlation was observed between myocardial injury score and
arterial and coronary sinus blood CK-MB and CK-MB mass
values (Table 4).
When the relationship between apoptotic index and net release
of cardiac markers in the post-ACC period was analysed, a
positive correlation was found between apoptotic index and net
release of hs-cTnT. No correlation was found between apoptotic
index and net release of CK-MB, CK-MB mass and and cTnI
(Table 5). A positive correlation was found between myocardial
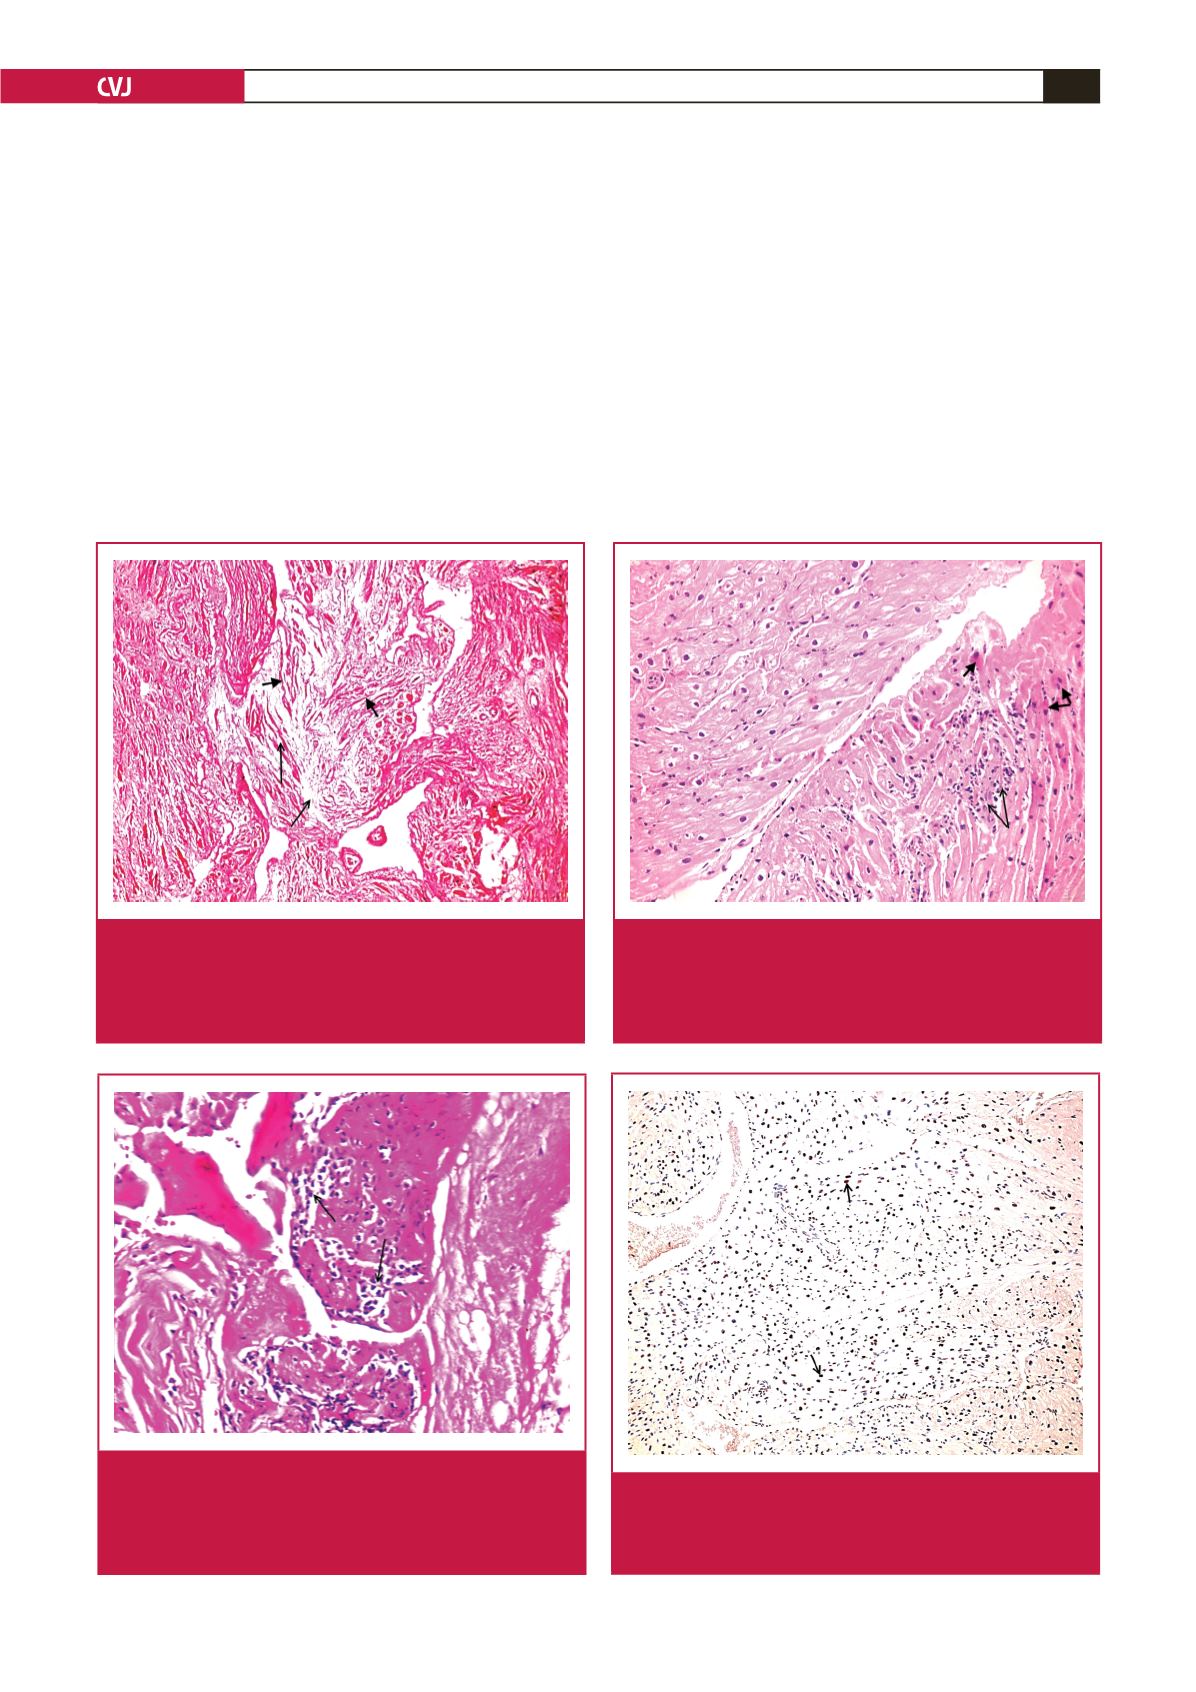
Fig. 1.
Histopathological section of atrial tissue showing
acute ischaemic changes with interstitial oedema (thin
arrow). In addition, myofibrils show thinning and wavy
patterns consistent with reperfusion injury (thick arrow)
(Grade 1, H&E × 100).
Fig. 2.
High-power representation of the histopathologi-
cal section of atrial tissue showing neutrophilic-to-
mixed inflammatory cell infiltration and transmigration
(arrow). Neutrophil activation plays a prominent role in
reperfusion injury (Grade 2, H&E × 200).
Fig. 3.
Histopathological section of atrial tissue showing
neutrophilic-to-mixed inflammatory cell infiltration and
transmigration (thin arrow) and necrotic myocytes
(thick arrow). Neutrophil activation plays a prominent
role in reperfusion injury (Grade 2, H&E × 200).
Fig. 4.
TUNEL-positive cardiomyocytes in an atrial tissue
sample obtained during reperfusion after aortic
declamping. The positive TUNEL reaction is visible
as dark staining in the nucleus (arrow) (TUNEL × 40).


