


 21 / 76

CARDIOVASCULAR JOURNAL OF AFRICA • Volume 28, No 2, March/April 2017
AFRICA
87
that used in the INTERHEART study,
15
was placed snugly in a
horizontal plane around the subject’s abdomen, mid-way between
the rib cage and the iliac crest, and standard tension was applied.
Demographic data, anthropometric measurements and
co-morbidities for individual patients were entered into a
database created using the Statistical Package for Social Sciences
(IBM SPSS statistics 20
®
). Correlation plots were made for BMI
(kg/m
2
) and WC (cm) in men and women, using 30 kg/m
2
as the
reference cut-off point for obesity, to determine corresponding
mean WC (
+
95% CI) in both genders. Similar plots were made
for BMI and WC using 94 cm in men and 80 cm in women as
reference cut-off points for obesity to determine corresponding
BMI (
+
95% CI) in both genders. Height (m) was also plotted
against WC in both men and women.
Patients were grouped into five WHO weight categories:
16
normal weight (category 1; BMI 18.5–24.9 kg/m
2
), overweight
(category 2; BMI 25.1–29.9 kg/m
2
), grade I obesity (category
3; BMI 30.0–34.9 kg/m
2
), grade II obesity (category 4; BMI
35.0–39.9 kg/m
2
), and grade III obesity (category 5; BMI
≥
40.0 kg/m
2
). Women were arbitrarily grouped into three WC
categories: category 1 (WC
≤
80 cm), category 2 (WC 80.0–87.9
cm) and category 3 (WC
≥
88 cm). Men were likewise grouped
into three WC categories: category 1 (WC
≤
94 cm), category 2
(WC 94.0–101.9 cm) and category 3 (WC
≥
102 cm).
Statistical analyses
With MedCalc
®
software,
17
using category 1 BMI and category
1 WC as references, relative risks (
+
95% CI) for hypertension,
dysglycaemia and dyslipidaemia were calculated for different
BMI and WC categories. Sample means and standard deviations
were calculated in the conventional way. Level of statistical
significance was taken to be
p
<
0.05.
Results
A total of 498 case notes were retrieved; 23 did not contain the
required data. Of 475 case notes of patients with the required
anthropometric parameters, 20 naturalised non-black citizens
of Botswana, 25 Asians and 12 Caucasians were excluded;
the remaining 418 black African patients were analysed. This
consisted of 215 men (51.4%) and 203 women (48.6%), mean
age 50.0
±
10.8 years, 80.6% of whom were Batswana and 19.4%
were other black Africans.
Only 7.2% had normal weight (BMI 18.5–24.9 kg/m
2
), 27.3%
were overweight (BMI 25–29.9 kg/m
2
) and 65.5% were obese
(BMI
>
30 kg/m
2
). Significantly more women were obese (77.8%)
compared to men (54.0%); mean BMI was 34.9
±
6.5 versus 31.0
±
4.9 kg/m
2
(
p
<
0.0001). Hypertension affected 77.8% (325/418)
and dysglycaemia 44.3% (185/418) of the patients. Lipid profiles
were not estimated in a third of the sample group. Dyslipidaemia
was documented in 67% of the remaining 279 patients.
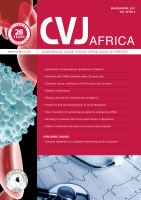
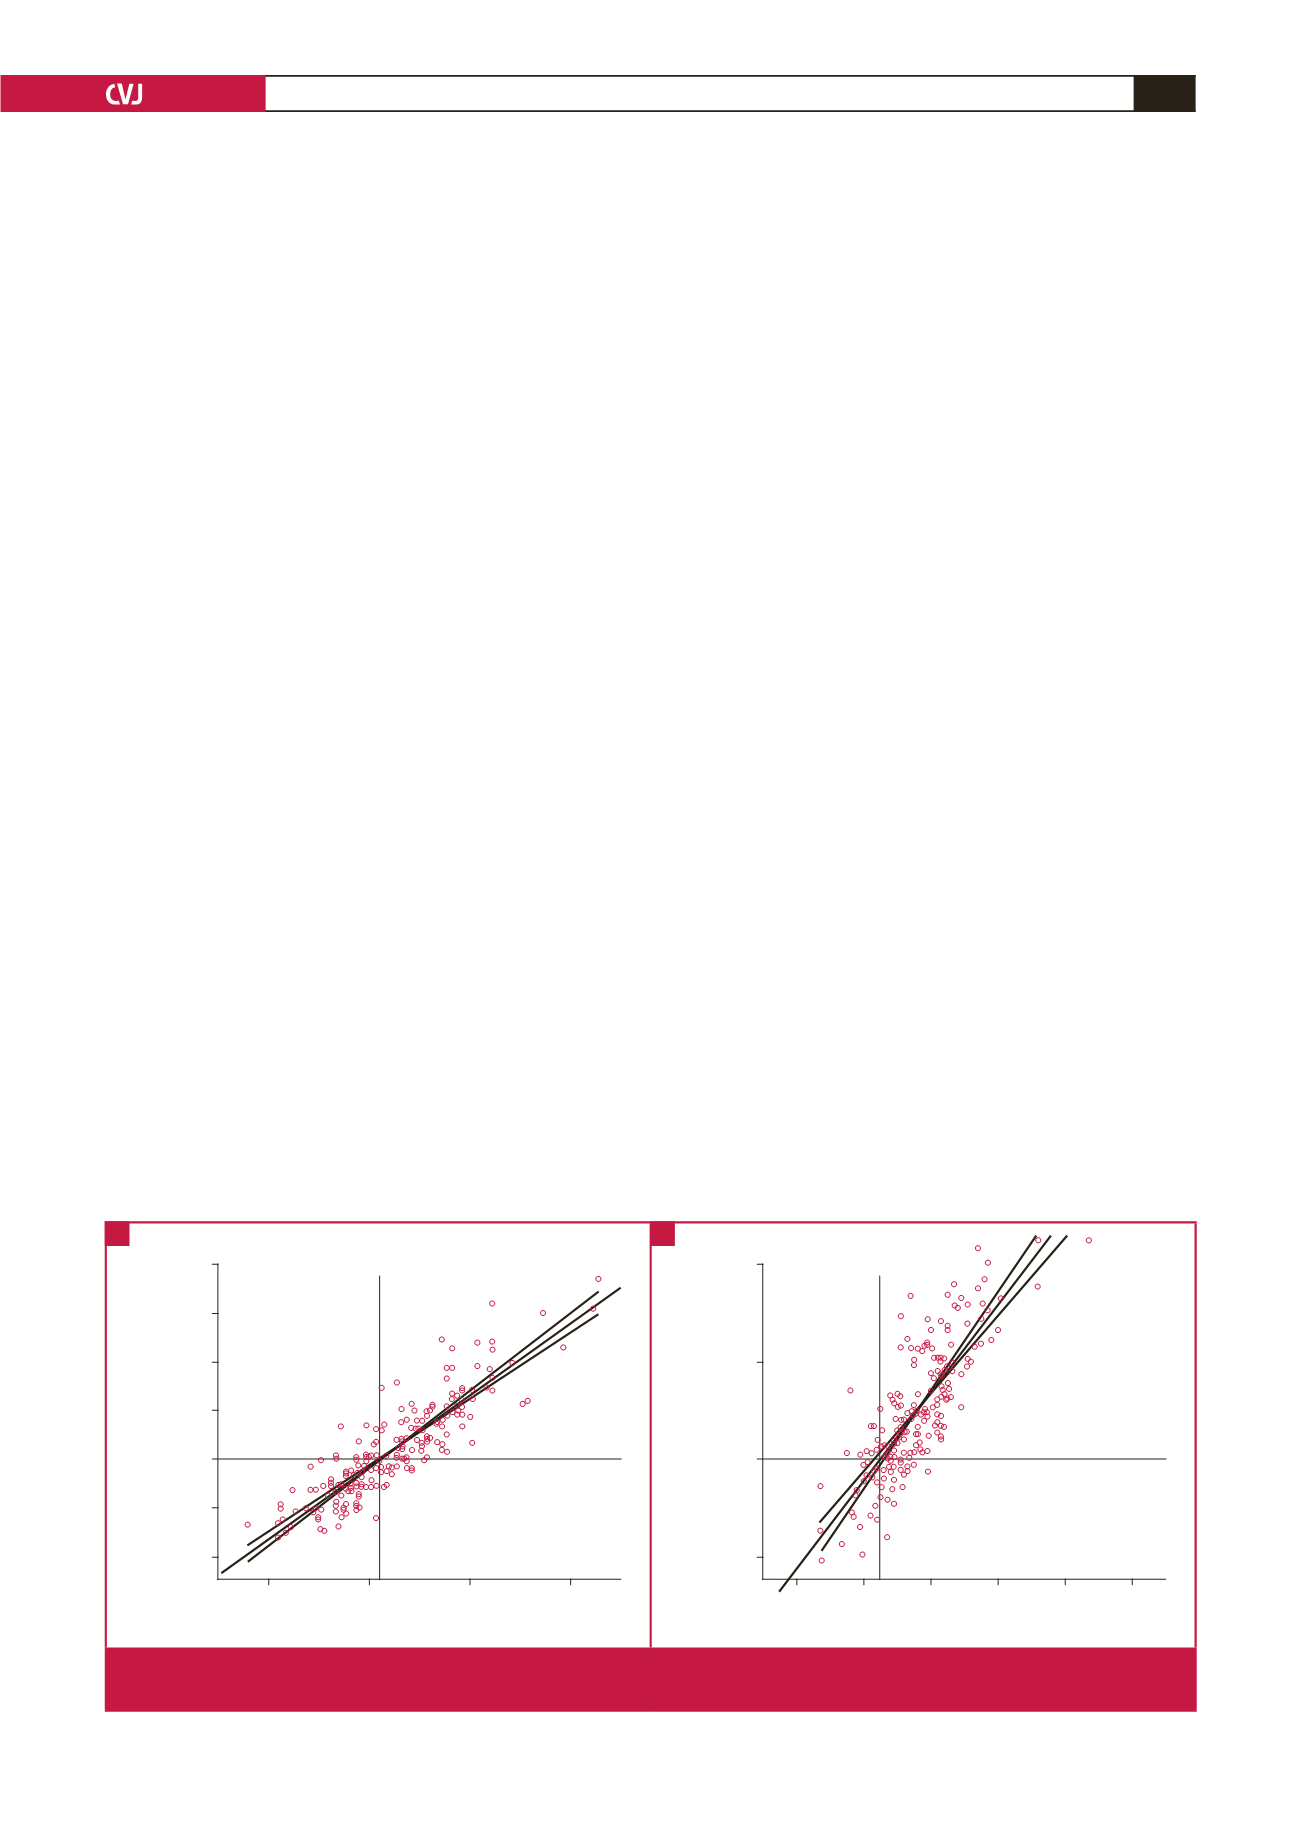
One man did not have a WC measurement and was excluded
from the correlation plots. WC directly correlated with BMI in
both genders (
R
2
linear
=
0.774 in men; 0.644 in women) with
new cut-off points of 98 cm (95% CI: 96.9–98.2 cm) in men and
85 cm (95% CI: 83.0–86.5 cm) in women, corresponding to BMI
of 30 kg/m
2
. (Fig. 1A, B). The current operational WC of 94.0
cm in black African men corresponded to a BMI of 28.7 kg/m
2
,
whereas in black women, the corresponding BMI was 28.0 kg/m
2
for a WC of 80 cm (Fig. 2A, B).
In both men and women, there was a poor correlation
between height and WC (
R
2
linear
=
0.036 in men; 0.005 in
women) (Fig. 3A, 2B). There was no correlation between age and
BMI among the 418 patients (
R
2
linear
=
0.001).
Table 1 shows the relative risks of hypertension, dysglycaemia
and dyslipidaemia for different BMI categories versus normal
weight (BMI
<
25 kg/m
2
) among 418 patients. Table 2 shows
the relative risks of any cardiovascular disease for different WC
categories versus current reference WC (
<
80 cm in women;
<
94 cm in men). Both tables demonstrate no overall statistically
significant risk relationship with hypertension, dysglycaemia
and dyslipidaemia. Separate analysis showed that WC
≥
102 cm
in men was associated with 21% increased total co-morbidity,
combining cardiometabolic and musculoskeletal disorders (RR
1.21; 95% CI: 1.03–1.42;
p
=
0.022).
50
45
40
35
30
25
20
80
100
120
140
WC (cm)
BMI (kg/m
2
)
R
2
linear
=
0.774
97.65
R
2
linear
=
0.644
50
40
30
20
60 80 100 120 140 160
WC (cm)
BMI (kg/m
2
)
84.85
Fig. 1.
Correlation between BMI (kg/m
2
) and WC (cm) in (A) 214 men and (B) 203 women with BMI = 30 kg/m
2
as cut-off point. BMI,
body mass index; WC, waist circumference.
A
B