


 22 / 76

CARDIOVASCULAR JOURNAL OF AFRICA • Volume 28, No 2, March/April 2017
88
AFRICA
Discussion
There are strong indications for examining body size in the current
context of affluence, social marketing and food consumption in
Botswana. Anthropometric measurements are frequently used
to determine parameters of overweight and obesity at most
points in the healthcare system and during many ‘wellness’
programmes. Knowing that a person’s BMI exceeds 30 kg/m
2
may be useful only in understanding the individual’s potential
cardiometabolic risk and total burden of co-morbidity. After
all, obesity may be an epiphenomenon for other cardiovascular
disease risk factors. But failure to recognise obesity as a major
health issue and its complex social and societal construct may
50
45
40
35
30
25
20
80
100
120
140
WC (cm)
BMI (kg/m
2
)
R
2
linear
=
0.774
94.0
28.7
R
2
linear
=
0.644
50
40
30
20
60 80 100 120 140 160
WC (cm)
BMI (kg/m
2
)
80.0
28.0
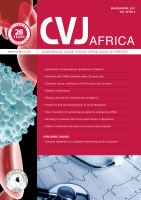
Fig. 2.
Correlation between BMI (kg/m
2
) and WC (cm) in (A) 214 men with WC
=
94.0 cm and (B) 203 women with WC
=
80 cm as
cut-off point. BMI, body mass index; WC, waist circumference.
A
B
2.0
1.9
1.8
1.7
1.6
1.5
80
100
120
140
WC (cm)
Height (m)
R
2
linear
=
0.036
1.8
1.7
1.6
1.5
1.4
60 80 100 120 140 160
WC (cm)
Height (m)
R
2
linear
=
0.005
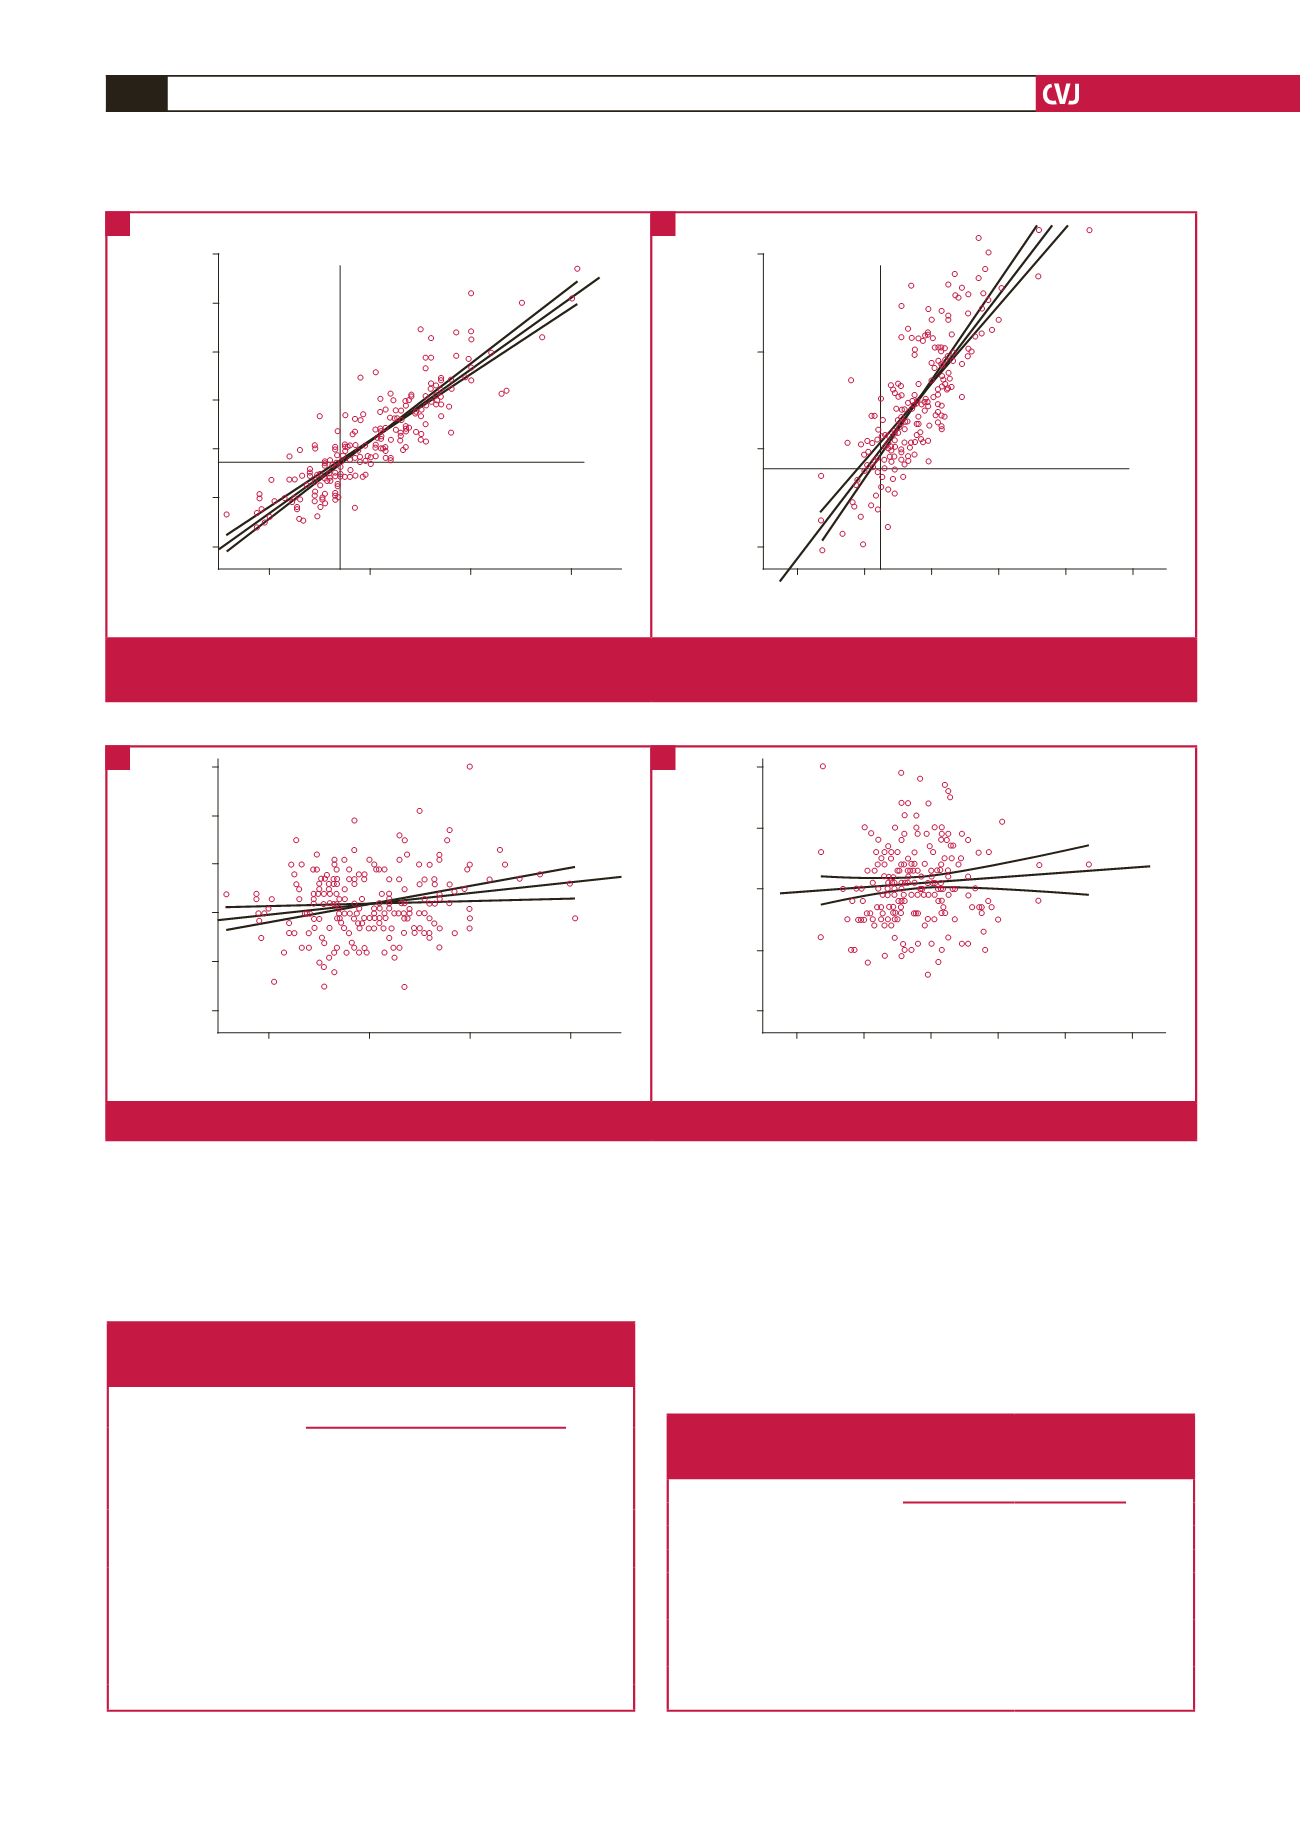
Fig. 3.
Poor correlation between height and WC in (A) 214 men and (B) 203 women. WC, waist circumference.
A
B
Table 1. Relative risks of hypertension, dysglycaemia and
dyslipidaemia for different BMI categories versus normal weight
(BMI
<
25 kg/m
2
) among 418 patients
WHO BMI category (kg/m
2
)
(1) Hypertension, (2) dysglycaemia,
(3) dyslipidaemia
p
-value
Relative risk
95% CI
Overweight (25–29.9)
(1) 0.99
(2) 0.94
(3) 1.24
(0.78–1.27)
(0.61–1.45)
(0.79–1.96)
0.95
0.78
0.36
Grade I (30–34.9)
(1) 1.09
(2) 0.88
(3) 1.24
(0.87–1.38)
(0.57–1.36)
(0.79–1.95)
0.45
0.57
0.36
Grade II (35–39.9)
(1) 1.12
(2) 1.01
(3) 1.07
(0.88–1.43)
(0.65–1.59)
(0.66–1.74)
0.45
0.95
0.77
Grade III (
>
40)
(1) 1.06
(2) 1.02
(3) 1.23
(0.82–1.38)
(0.64–1.62)
(0.76–1.98)
0.64
0.94
0.40
WHO, World Health Organisation; BMI, body mass index.
Table 2. Relative risks of any cardiovascular disease for different
waist circumference categories versus current reference waist
circumferences (
<
80 cm in women;
<
94 cm in men)
Waist circumference category (cm)
Any CVD relative risk
p
-value
Relative risk
95% CI
Category 2
Men (94–101.9)
1.04
(0.91–1.18)
0.61
Women (80–87.9)
1.15
(0.84–1.59)
0.39
Category 3
Men (
>
102)
1.10
(0.99–1.22)
0.08
Women (
>
88)
1.17
(0.86–1.58)
0.32
CVD, cardiovascular disease refers to hypertension, dysglycaemia and dyslipi-
daemia.