


 47 / 84

CARDIOVASCULAR JOURNAL OF AFRICA • Volume 29, No 2, March/April 2018
AFRICA
109
excluded due to incomplete data. Therefore 293 were used for
data analysis, giving a response rate of 95.1%.
The age range of the study population was between 25 and 76
years with a mean of 44.8
±
9.7 years. Two hundred and eighty-
six (97.6%) of the subjects were aged between 25 and 65 years.
The rest of their socio-demographic characteristics is shown in
Table 1.
Fifty-seven of the drivers (19.5%; 95% CI: 14.9–24.0%)
were active smokers while 217 (74.1%) and 19 (6.5%) were
non-smokers and ex-smokers, respectively. The prevalence of
alcohol intake was 71.1% (95% CI: 65.7–76.2%). The majority
consumed various types of alcoholic beverages: beer, spirits and
alcohol-based herbal medications. The intake of alcohol was
about four bottles of beer per week (Table 1).
The mean BMI of the subjects was 27.2
±
9.6 kg/m
2
, with
121 (41.7%) and 61 (21.1%) being in the overweight and
obese categories, respectively. The prevalence of overweight
and obesity were 41.7% (95% CI: 36.0–47.4%) and 21.1% (95%
CI: 16.3–25.6%), respectively, giving a combined prevalence
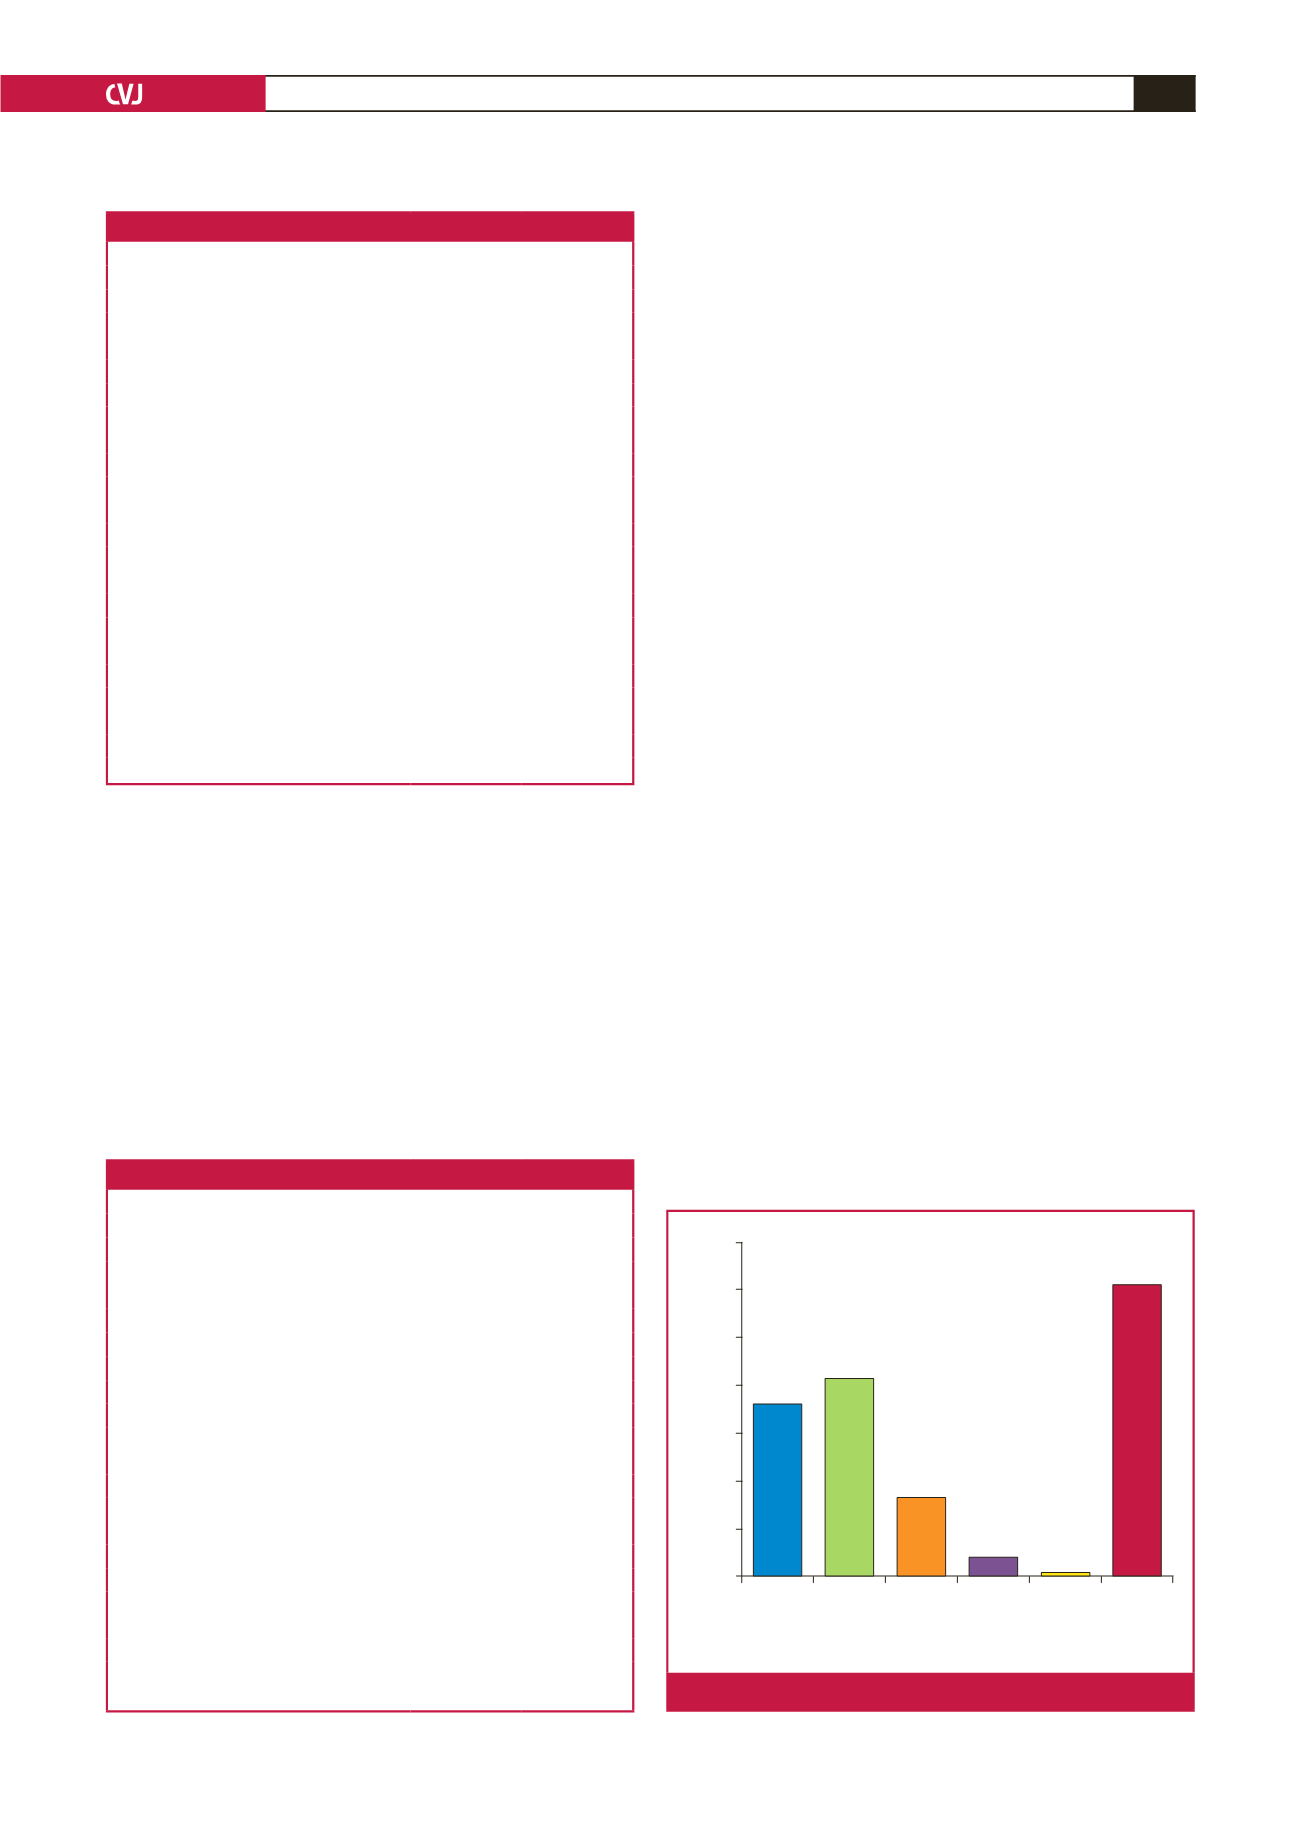
of 62.8% (95% CI: 57.2–68.3%) (Table 2). Fig. 2 shows the
frequency of the various classes of obesity.
The mean waist circumference (WC) of the study population
was 94.9
±
11.9 cm, while the prevalence of abdominal obesity,WC
≥
102 cm, was 24.1% (95% CI: 19.2–29.0%). The mean neck
circumference of the study population was 39.2
±
2.8 cm, with
28.8% having a neck circumference
≥
40 cm (Table 2).
The mean systolic blood pressure (SPB) and diastolic blood
pressure (DBP) of the subjects were 136.3
±
20.9 and 83.2
±
13.6 mmHg, respectively. One hundred and sixteen cases of
hypertension were identified, giving a prevalence rate of 39.7%
(95% CI: 34.0–45.25%). Eighty-eight (75.9%) were detected
for the first time during the study. Twenty-eight (24.1%) were
previously known hypertensives, with six (21.4%) having good
BP control (Table 2).
The mean fasting blood glucose level (FBG) of the study
population was 108.2
±
39.7 mg/dl (6.01
±
2.2 mmol/l). Forty
of the subjects (13.9%; 95% CI: 9.7–17.6%) had diabetes and
seven (2.4%) were previously known diabetics. Ninety (31.3%)
had impaired fasting glucose levels. Prevalence of abnormal
glucose profiles (diabetes + impaired FBG) was 45.2% (95% CI:
39.3–50.7%) (Table 2).
The mean TC of the study population was 218.4
±
33.2 mg/
dl (5.66
±
0.86 mmol/l). The overall lipid profile is presented in
Table 3. One hundred and twenty-eight (43.7%) of the subjects
had normal lipid profiles while 165 (56.3%) had one form of
dyslipidaemia or another. The prevalence of dyslipidaemia in the
study was 56.3% (95% CI: 50.6–62.0%), while the prevalence of
atherogenic dyslipidaemia, i.e. elevated TC/HDL-C was 33.1%
(95% CI: 27.7–38.5%) (Table 3).
The mean METs/hour of the subjects was 638.8
±
565.5, with
66% of them spending most of their time in the travel domain
Table 1. Socio-demographic characteristics of the subjects
Parameters
Mean
±
SD
n
(%)
Age (years)
44.8
±
9.7
25–44
147 (50.2)
45–64
139 (47.4)
>
65
7 (2.4)
Educational level
Primary
77 (26.3)
Secondary
177 (60.4)
Tertiary
37 (12.6)
Marital status
Married
265 (90.4)
Single
22 (7.5)
Widowed
3 (1.0)
Divorced
3 (1.0)
Number of years as a professional driver
20.0
±
10.4
Number of hours driven per week
41.9
±
28.7
Smoking pattern
Active smokers
57 (19.5)
Non-smokers
217 (74.1)
Ex-smokers
19 (6.5)
Alcohol use
User
208 (71.1)
Teetotaler
85 (29.0)
BMI categories
Normal Overweight Class I
obesity
Class II
obesity
Class III
obesity
Overweight/
obese
Prevalence (%)
70
60
50
40
30
20
10
0
Fig. 2.
Prevalence of the various categories of BMI.
Table 2. Measures of obesity, BP and glucose profile of the subjects
Parameter
Mean
±
SD
n
(%)
BMI (kg/m
2
)
27.2
±
9.6
Waist circumference (cm)
96.4
±
0.9
Proportion
<
102 cm
168 (66.4)
Proportion
≥
102 cm
125 (43.3)
Neck circumference (cm)
39.2
±
2.8
Proportion
<
40 cm
171 (59.6)
Proportion
≥
40 cm
131 (41.6)
Blood pressure
SBP (mmHg)
136.3
±
20.9
DBP (mmHg)
83.2
±
13.6
Total number of hypertensives
116 (39.7)
Newly diagnosed
88 (75.9)
Previously known hypertensives
29 (9.6)
Blood glucose
Fasting blood glucose (mg/dl)
108.2
±
39.7
Normoglycaemia
158 (54.9)
Impaired fasting glucose
90 (31.3)
Total number of diabetics
40 (13.9)
Newly diagnosed diabetics
33 (82.5)
Previously known diabetics
7 (17.5)
SBP: systolic blood pressure; DBP: diastolic blood pressure.