
CARDIOVASCULAR JOURNAL OF AFRICA • Volume 29, No 2, March/April 2018
108
AFRICA
Laboratories.
27
Participants with a fasting plasma glucose value
of
≥
126 mg/dl (6.99 mmol/l), self-volunteered history of diabetes
and or use of insulin/oral hypoglycaemic agents were regarded
as diabetic, while a fasting plasma glucose level between 100 and
125 mg/dl (5.55–6.94 mmol/l) was regarded as impaired fasting
glucose.
28
For the purpose of this study, abnormal glucose profile
was defined as a combination of impaired fasting glucose and
frank diabetes.
Abnormal lipid profile was determined from the ATP III
guidelines of 2001; total cholesterol (TC)
≥
240 mg/dl (6.22
mmol/l), high-density lipoprotein cholesterol (HDL-C)
≤
40 mg/
dl (1.04 mmol/l), and low-density lipoprotein cholesterol (LDL-
C)
>
160 mg/dl (4.14 mmol/l) and triglycerides
>
150 mg/dl (1.70
mmol/l).
29
Atherogenic dyslipidaemia was defined by the Castelli
index as TC/HDL-C
>
3.4.
30
The physical activity level of participants was assessed with
the World Health Organisation (WHO) Global Physical Activity
Questionnaire-2 (GPAQ-2), which assesses physical activity
in four domains of work, travel, recreational and resting.
31
The product of the exercise intensity in metabolic equivalents
(METs), duration of activity in hours and the number of times
per week, expressed as METs/hour was regarded as exercise
volume. A MET/hour value less than 600 per week was taken as
physical inactivity.
31
Statistical analysis
Data entry and analysis were done with the Statistical Package for
the Social Sciences 17.0 version (SPSS, Inc, Chicago, IL, USA).
Continous data are presented as mean and standard deviation.
Categorical variables are expressed as proportions. Pearson’s
correlation was used to determine how some independent
numerical variables (age, BMI, number of years of professional
driving and number of driving hours/week) correlated with the
major outcome variables (systolic and diastolic BP, and abnormal
glucose profile). Furthermore, the independent variables were
dichotomised to look for an association between them and the
outcome variables, hypertension and abnormal glucose profile
using the chi-squared test. Level of statistical significance was set
at
p
<
0.05 and confidence interval at 95%.
Multivariate analysis was done using a forward stepwise
binary logistic regression in order to assess for independent
predictors of hypertension and abnormal glucose. We included
predictor variables with associations at a significance level of
p
≤
0.2 on univariate analysis in order to accommodate for
important risk factors.
Results
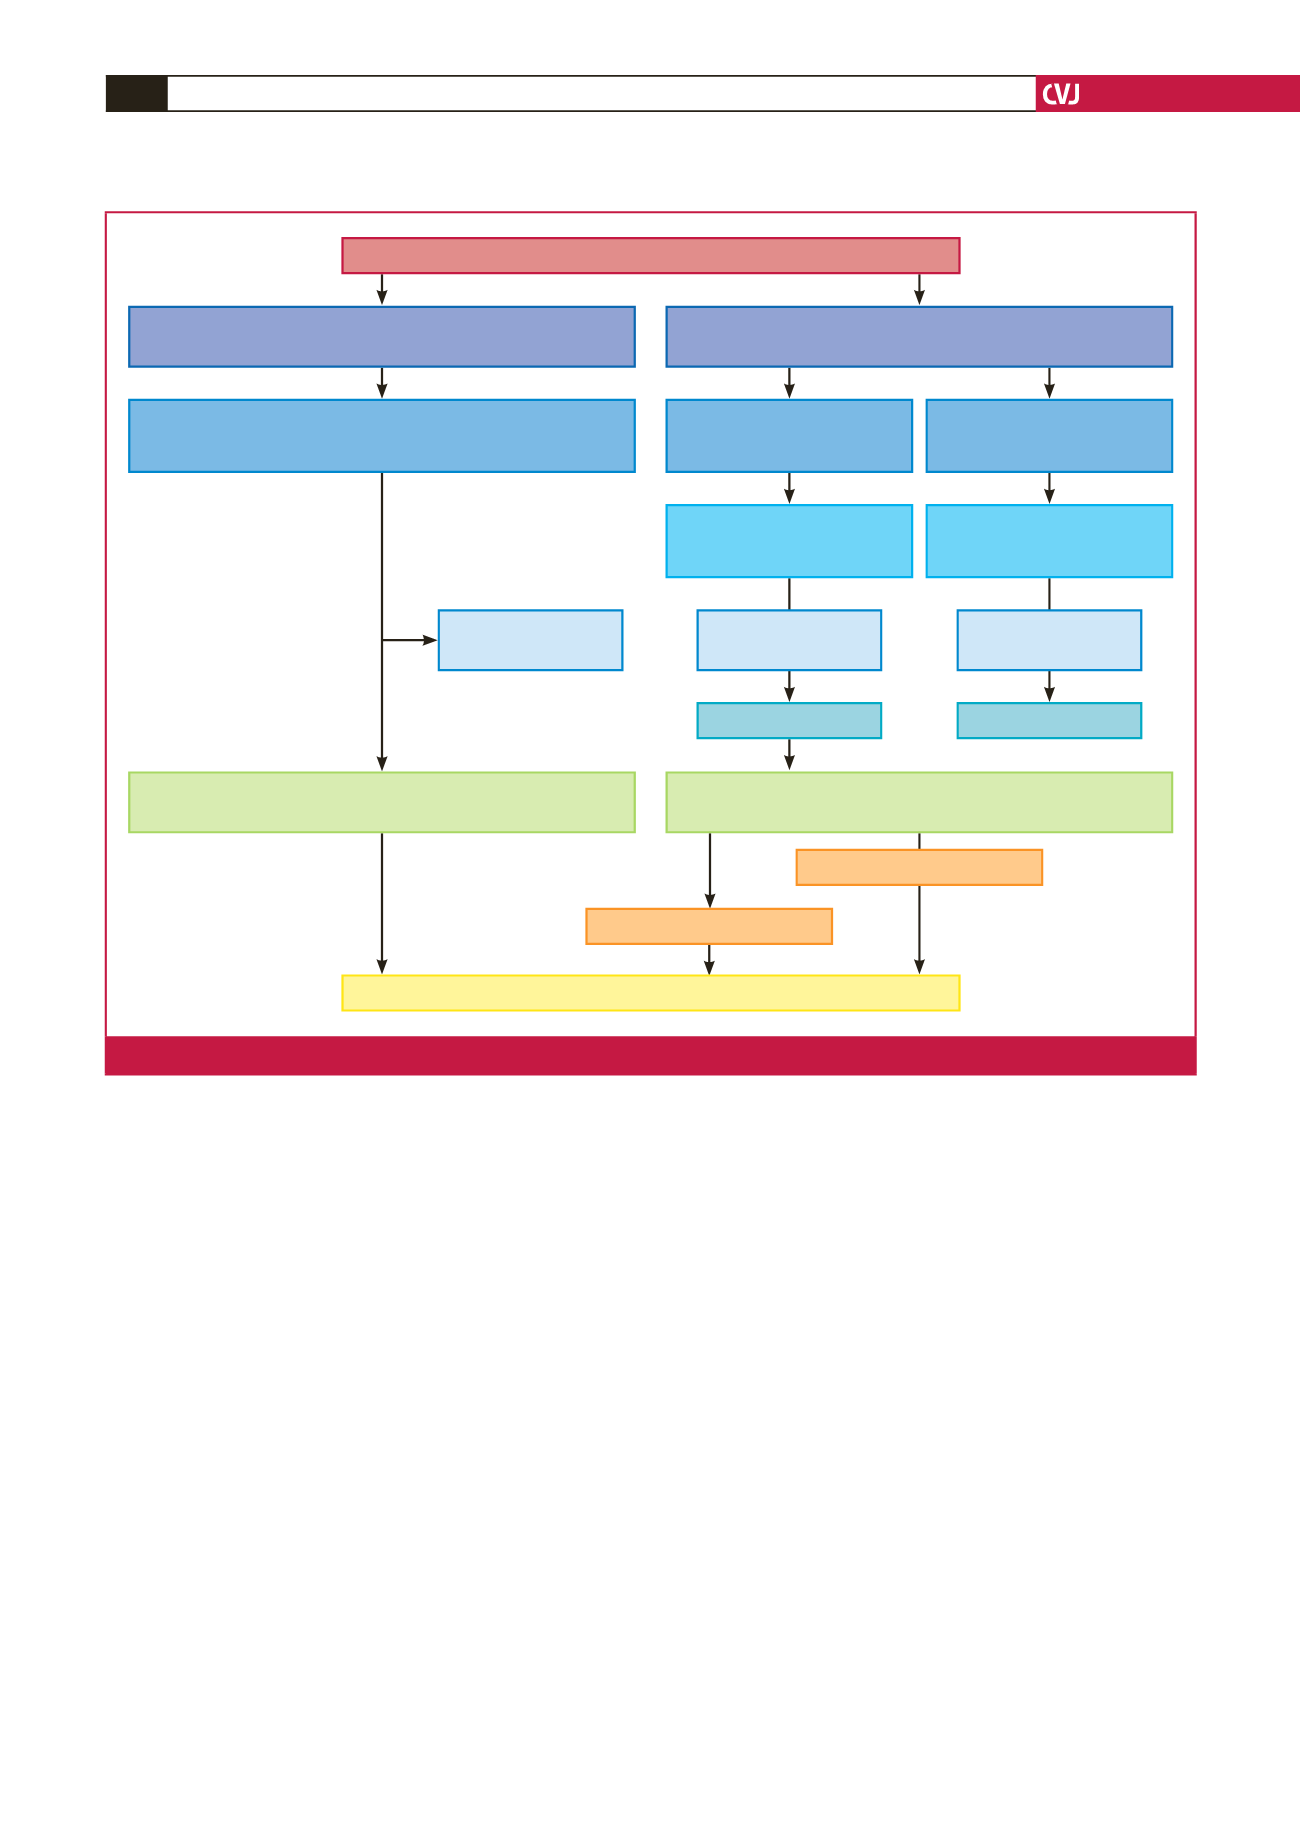
A total of 308 drivers were recruited for the study. Fifteen were
8 900 LDD operate from Lagos
One company selected (annual health check coincided with period
of study and drivers from across the country could be accessed).
Total drivers = 168 and all invited to participate
165 LDD with access to regular health
and safety checks agreed to participate
8 500 drivers without access to periodic health checks
working out of 25 motor parks in Lagos
Two companies identified (n = 400)
have access to yearly health and safety checks
Five parks serving mostly
northern routes
(2 500 drivers)
Two parks randomly selected
(1 000 drivers) and 100 drivers
approached to participate
34 excluded due to
refusal to participate
66 drivers recruited
Final study sample (n = 308). All completed questionnaire
17 parks serving mainly
southern routes
(6 000 drivers)
143 LDD without access to regular health and
safety checks agreed to participate
Two parks randomly selected
(2 000 drivers) and 100 drivers
approached to participate
77 drivers recruited
Three excluded
due to refusal
23 excluded due to
refusal to participate
15 questionnaires were voided
293 was used for analysis
Fig. 1.
Consort diagram describing how participants were recruited into the study. LDD: long-distance commercial drivers.


