


 48 / 84

CARDIOVASCULAR JOURNAL OF AFRICA • Volume 29, No 2, March/April 2018
110
AFRICA
(Fig. 3). The prevalence of physical inactivity in the study
population, defined as total METs/hour in all four domains
<
600 per week was 50.9% (95% CI: 53.1–64.3%). Two hundred
and thirty-four (80.4%) of the subjects were inactive, 56 (19.2%)
were low active, while one (0.3%) was medium active. None was
highly active.
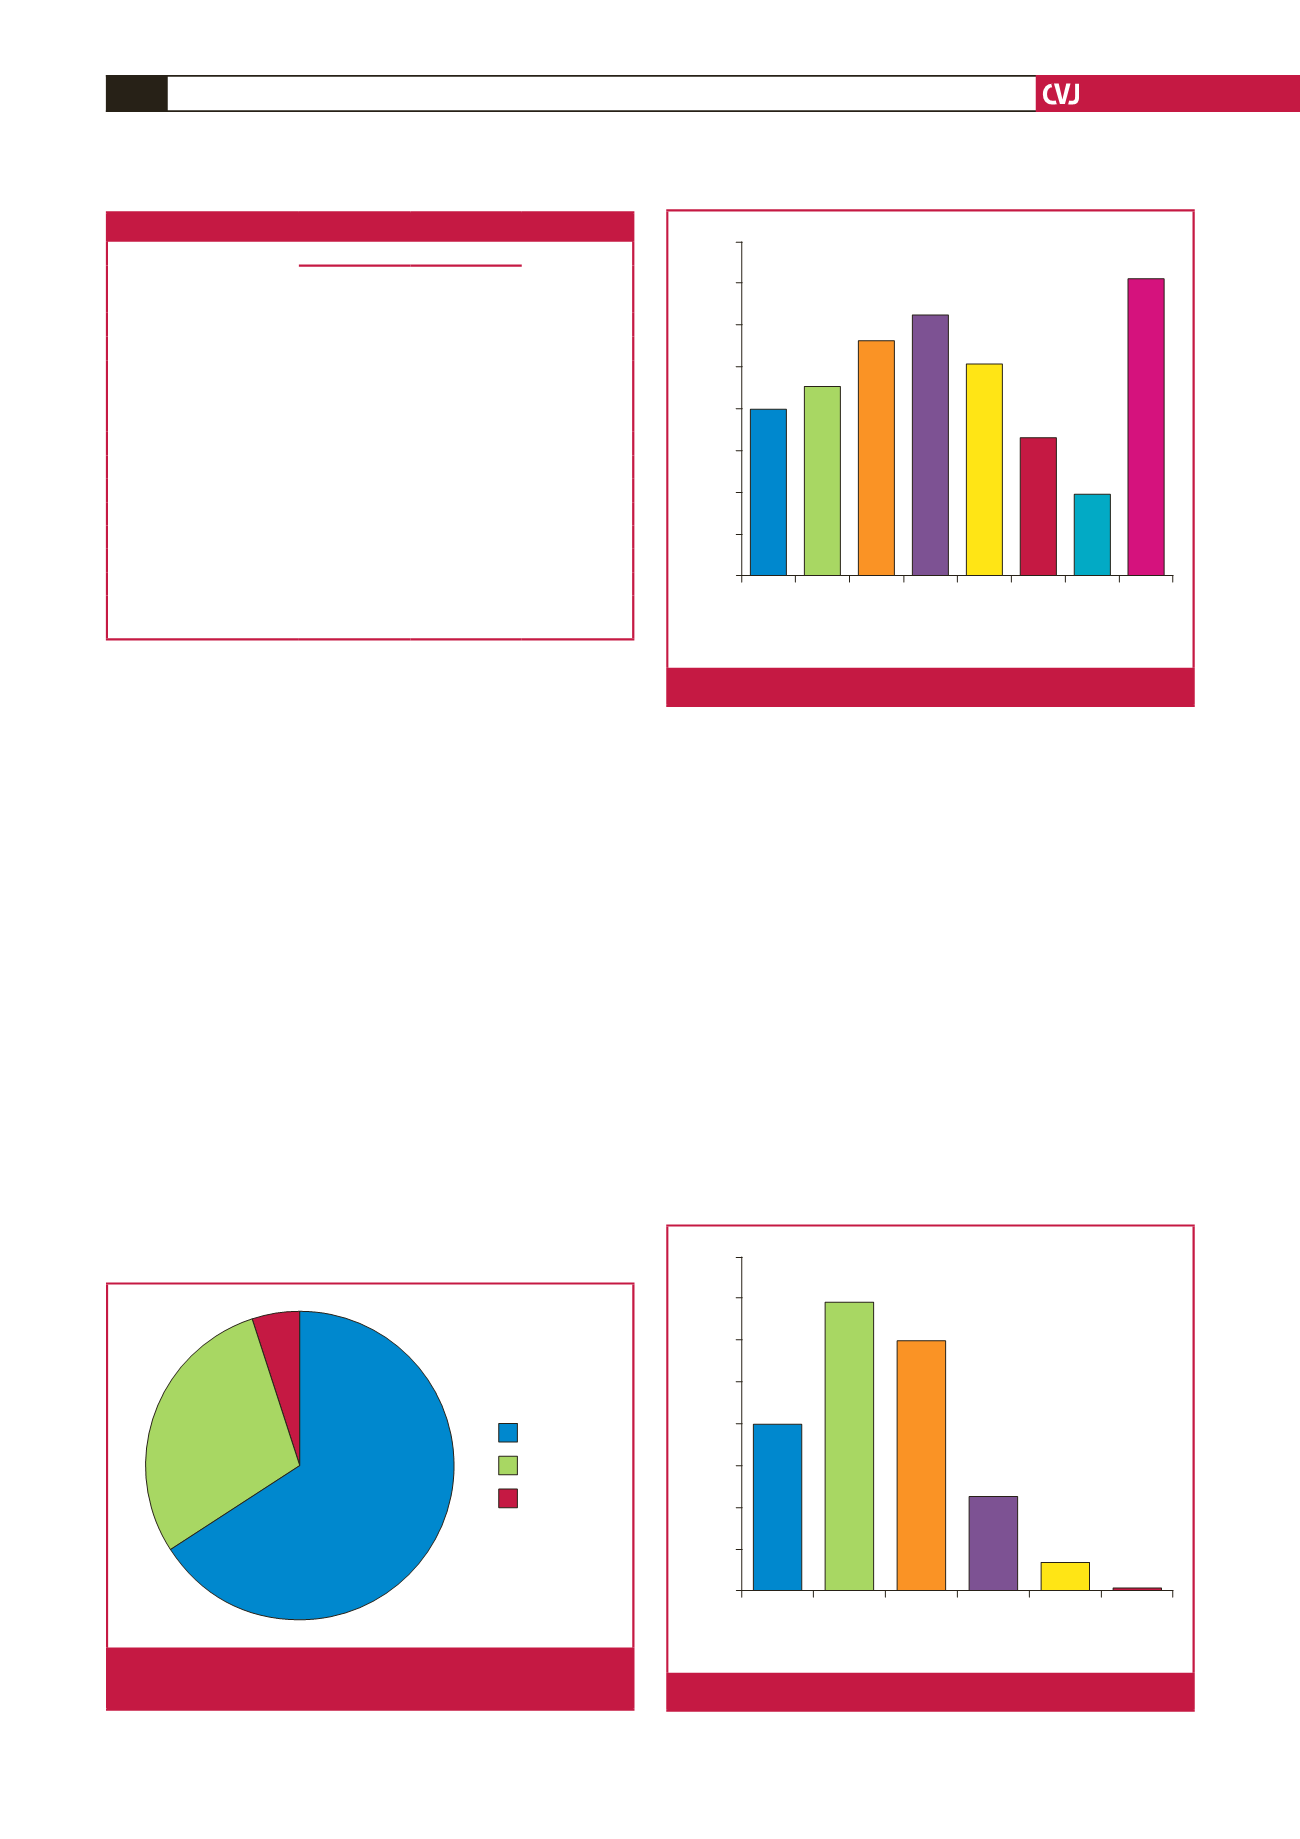
Onehundredand thirty-two (45.1%) subjectshadco-occurrence
of two or more risk factors. The most prevalent combination was
the duo of hypertension and abnormal glucose profile. Fig. 4
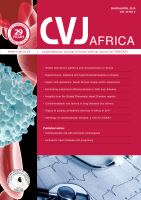
shows the common single risk factors, while common risk factor
combinations are shown in Fig. 5. Alcohol use and physical
inactivity were the commonest behavioural risk factors, while
overweight/obesity, hypertension and dyslipidaemia were the
three most common metabolic risk factors in the subjects (Fig. 6).
Pearson’s correlation was used to determine how some
independent numerical variables (age, BMI, number of years
of professional driving and number of driving hours/week)
correlated with the major outcome variables (SBP, DBP and
fasting blood glucose level). Age correlated significantly with
SBP (
r
=
0.362,
p
<
0.001) and DBP (
r
=
0.335,
p
<
0.001). BMI
also correlated significantly with SBP (
r
=
0.288,
p
<
0.001) and
DBP (r
=
0.208,
p
<
0.001). BMI alone correlated significantly
with fasting glucose (
r
=
0.136,
p
=
0.021).
Furthermore, the independent variables were dichotomised to
look for an association between them and outcome variables of
hypertension and abnormal glucose profile. In this model only
age, BMI, number of years of professional driving and waist
circumference had significant associations with hypertension,
while none of these except BMI had a significant association
with abnormal glucose levels (Table 4).
Multivariate analysis was done using a forward stepwise
binary logistic regression in order to assess for independent
predictors of hypertension and abnormal blood glucose levels.
We included predictor variables with associations at a significance
level of
p
≤
0.2 on univariate analysis in order to accommodate
for important risk factors. The final logistic regression model
(Table 5) showed that as age and BMI increased, the chances of
becoming hypertensive increased 1.09 and 2.99 times (OR 1.09;
95% CI: 1.06–1.1,
p
<
0.0001; OR 2.99; 95% CI: 1.69–5.31,
p
<
0.0001), respectively.
Table 3. Pattern of lipid profiles of the subjects
Parameter
Mean
±
SD
n
(%)
mg/dl
mmol/l
TC
218.4
±
33.2
5.66
±
0.86
LDL-C
136.4
±
33.6
3.53
±
0.87
HDL-C
57.7
±
15.3
1.49
±
0.40
TG
122.7
±
64.1
1.39
±
0.72
Non-HDL-C
161.0
±
31.5
TC/HDL-C
3.8
±
1.9
TG/HDL
3.7
±
2.6
Abnormal profiles
Elevated TC
81 (27.8)
Elevated LDL-C
72 (24.6)
Low HDL-C
19 (6.5)
Elevated TC/HDL-C
96 (33.1)
Elevated TG/HDL-C
38 (13.0)
TC: total cholesterol; LDL-C: low-density lipoprotein cholesterol; HDL-C:
high-density lipoprotein cholesterol; TG: triglycerides.
Travel
Work
Recreation
66%
29%
5%
Fig. 3.
Contributions of the GPAQ2 domains to total physical
activity of the subjects.
Hyper-
tension
Ab-
normal
Dyslip-
idae
Obesity Physical Athe-
rogen
Smoking Alcohol
Prevalence (%)
80
70
60
50
40
30
20
10
0
Fig. 4.
Prevalence of single risk factors among the subjects
Number of risk factors
0
1
2
3
4
5
Prevalence (%)
40
35
30
25
20
15
10
5
0
20
34,8
30
11,3
3,4
0,3
Fig. 5.
Prevalence of multiple risk factors among the subjects.