


 49 / 84

CARDIOVASCULAR JOURNAL OF AFRICA • Volume 29, No 2, March/April 2018
AFRICA
111
For abnormal glucose level with increasing BMI, the chances
of having abnormal glucose level increased 2.5 times (OR 2.39;
5% CI: 1.33–4.30;
p
=
0.004). Other variables such as physical
activity, number of driving hours, waist circumference and
professional driving years were not independently associated
with our outcome parameters and were excluded from the final
regression model.
Discussion
The major finding of this study was that male long-distance bus
drivers had a higher prevalence of clustering of cardiometabolic
risk factors than the general population, and in addition, most
them were unaware of their risk status.
12,14
This clustering places
them at a higher risk for CVD and contributes significantly to
the already burgeoning CVD burden in the general population.
Importantly, a CVD event in a driver while driving portends
grave danger to him, the passengers and other road users.
The prevalence of hypertension in this study was 39.7%,
with 75.9% being newly diagnosed. This is higher than the
recent pooled national prevalence rate of 28.9% but lower than
the 44.9% prevalence from a national study on blindness and
hypertension.
32,33
Previous local studies reported prevalence rates
ranging from 21.4 to 33.5%.
19-21
Studies from Brazil and Iran
reported prevalence rates of 45.6 and 44.6%, respectively, much
higher than their national prevalence rates.
12,13
Professional drivers, by nature of their occupation, are
largely sedentary and indulge in dietary indiscretions, which
could lead to obesity. From this study, obesity was a predictor of
hypertension. Furthermore, BMI and longer duration of years
of professional driving significantly correlated with the risk
of hypertension, similar to findings by Sangaletti
et al
.
12
This
association is plausible, as drivers who drive for long hours over
many years tend to gain weight inappropriately due to physical
inactivity and dietary indiscretion.
In addition to high prevalence of hypertension, optimal blood
pressure control was equally low among the subjects. Among the
9.6% previously known hypertensives, only 21.4% had optimal
BP control. BP control is generally very low in Nigeria, ranging
between five and 29.4%.
34,35
Ignorance, long travel times, poor
access to standard medical care, the asymptomatic nature of
hypertension and the relative lack of self-care among males have
been suggested as possible causes of poor BP control among
long-distance drivers.
12
The prevalence of abnormal glucose profiles in this study
was 45.2%, comprising 31.3 and 13.9% for impaired fasting
gliucose levels and diabetes mellitus (DM), respectively. Most
of the diabetics were diagnosed for the first time during this
study. There are no local studies for comparison but the reported
prevalence of DM from this study is much higher than the 4.5%
reported by the International Diabetes Federation (IDF) and the
eight to 10% from a study on the general population.
36,37
In Iran,
Table 4. Association between independent variables and
hypertension and abnormal glucose levels
Hypertension
Abnormal glucose levels
Parameter
% (95% CI)
p
-value % (95% CI)
p
-value
Driving hours/week
0.250
0.076
≥
36
42.9 (35.0–50.9)
35.6 (27.9–43.2)
<
36
36.3 (28.5–44.2)
25.9 (18.6–33.2)
Years of professional driving
<
0.001
0.320
≥
20
56.2 (43.1–64.4)
33.1 (25.4–40.8)
<
20
23.1 (16.2–30.0)
27.7 (20.3–35.0)
Physical activity
0.279
0.205
<
600 METs/week
42.6 (34.6–50.5)
27.6 (20.3-34.9)
≥
600 METs/week
36.3 (28.5–44.2)
34.5 (26.7-42.3)
BMI
<
0.001
0.002
Overweight/obese
48.4 (41.1–55.6)
37.8 (30.7–44.9)
Normal
25.9 (17.7–34.2)
19.8 (12.2–27.4
Alcohol use
0.840
0.807
Yes
40.1 (33.4–46.8)
31.2 (24.9–37.6)
No
38.8 (28.5–49.2)
29.8 (20.0–39.5)
Smoking
0.477
0.808
Yes
43.9 (31.0–56.7)
32.1 (19.9-44.4)
No
38.7 (28.5-49.2)
30.5 (24.6-36.4)
WC (cm)
<
0.001
0.076
>
102
61.4 (50.0–72.8)
39.7 (28.1–51.3)
≤
102
33.0 (26.8–39.2)
28.3 (22.3–34.3)
Age
<
0.001
0.499
≥
45
54.5 (46.4–62.6)
32.6 (25.0–40.3)
<
45
25.2 (18.2–32.2)
29.0 (21.6–36.3)
BMI: body mass index; WC: waist circumference; METs: metabolic equivalents.
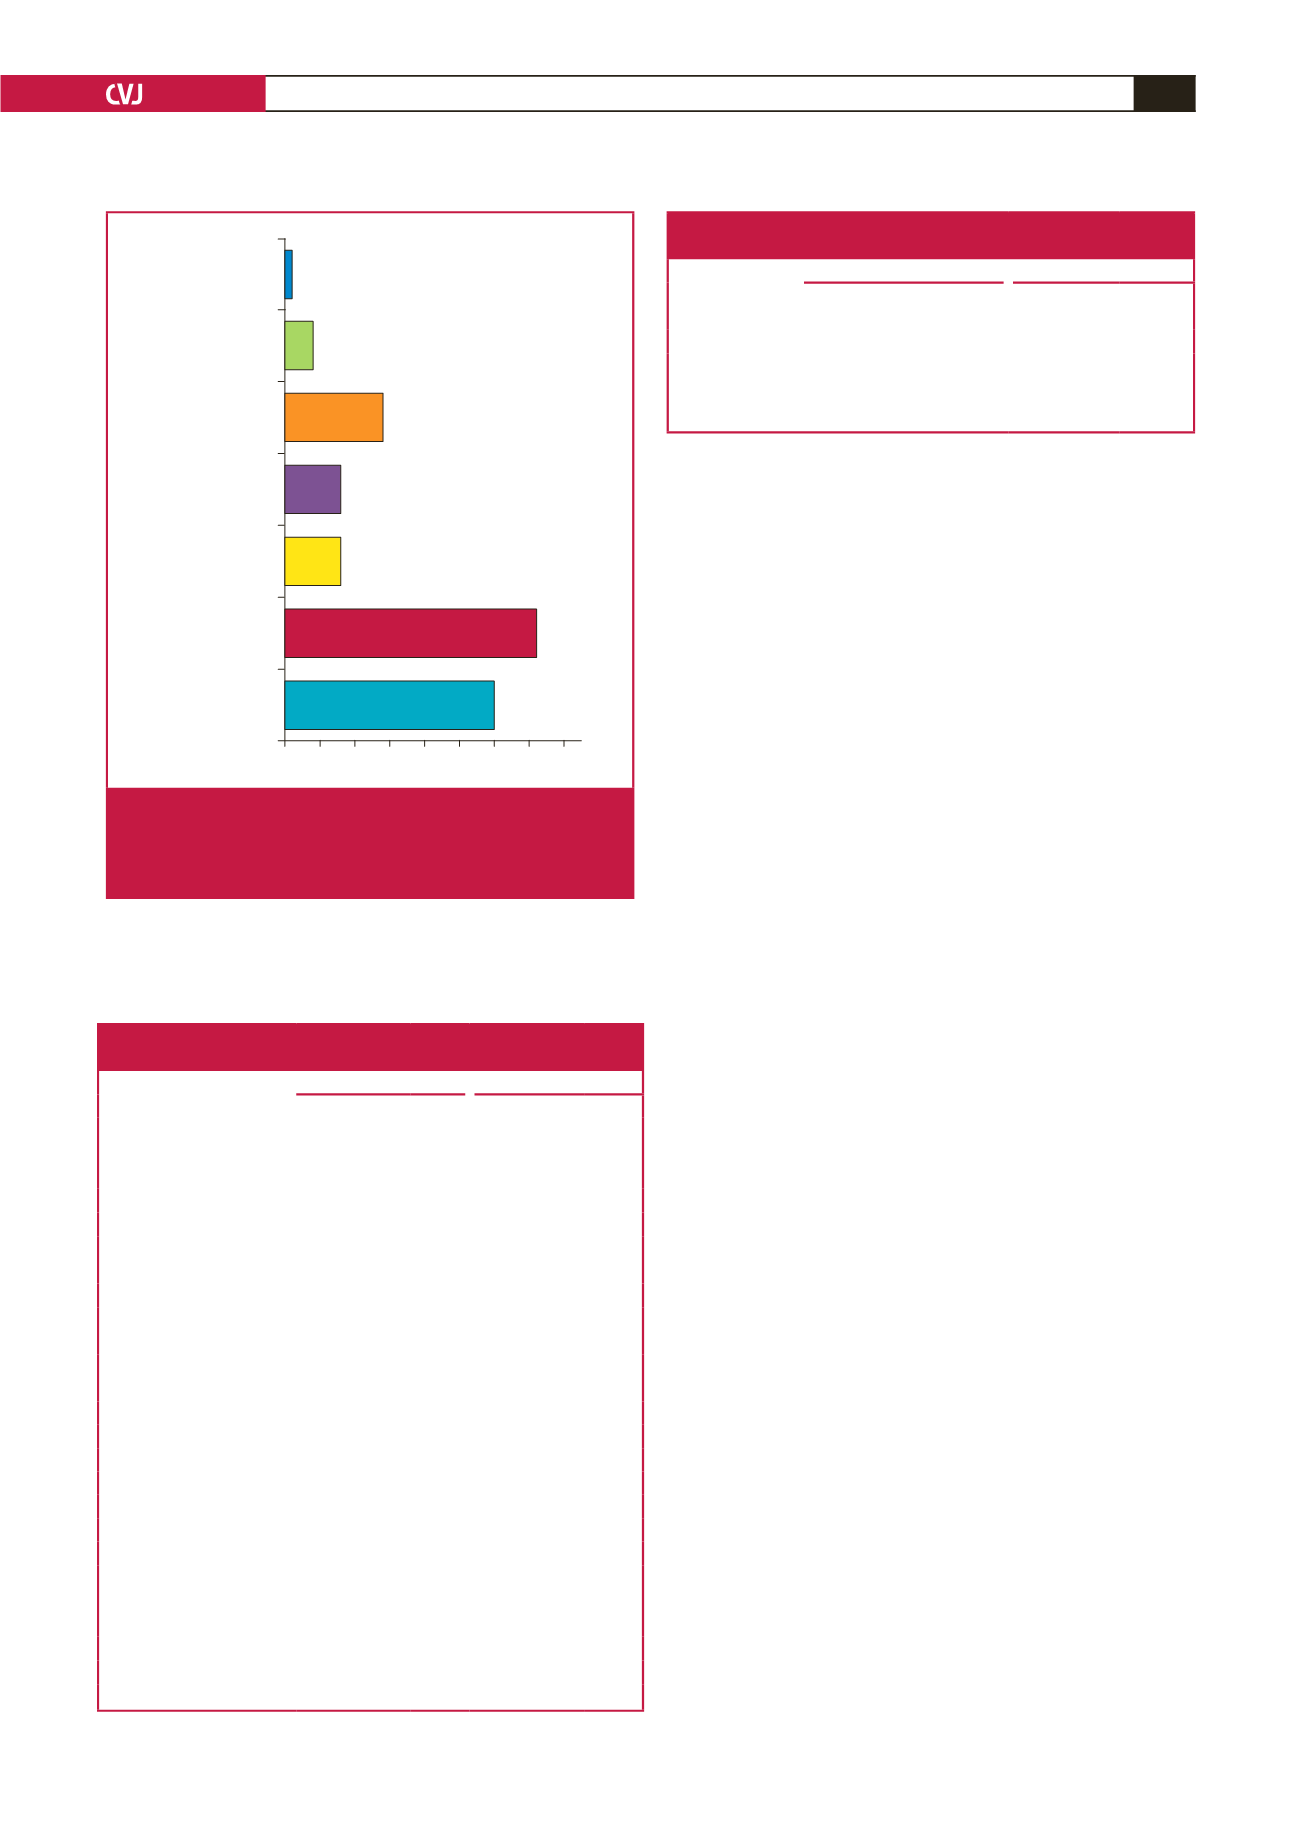
HTN,
abnormal glucose,
high WC, smoking,
high TC/HDL
HTN,
abnormal glucose,
high WC, smoking
HTN,
abnormal glucose,
high WC
HTN,
abnormal glucose,
smoking
HTN,
abnormal glucose,
TC/HDL ratio
HTN,
abnormal glucose
None
59 (20.1%)
36 (12.3%)
8 (2.73%)
8 (2.73%)
14 (4.8%)
4
1
n
= 293 (%)
0 5 10 15 20 25 30 35 40
Fig. 6.
Prevalence of different combinations of risk factors in
the subjects. HTN: hypertension; WC: waist circumfer-
ence; TC: total cholesterol; HDL: high-density lipopro-
tein cholesterol.
Table 5. Logistic regression on predictors of hypertension and
abnormal glucose levels
Hypertension
a
Abnormal glucose levels
b
Variables
OR (95% CI)
p
-value OR (95% CI)
p
-value
Age
1.090 (1.058–1.23)
<
0.0001
ns
ns
Overweight/obesity 2.99 (1.69–5.32)
<
0.0001 2.39 (1.33–4.3)
0.04
a
Variables excluded from the final model were: physical activity, number of driv-
ing hours, waist circumference and professional driving years.
b
Variables excluded from the final model were: age, physical activity, number of
driving hours, waist circumference and professional driving years.