
CARDIOVASCULAR JOURNAL OF AFRICA • Volume 30, No 5, September/October 2019
270
AFRICA
maximum currents appeared at –40-mV test potential (Fig.
3), which was used to analyse the time-dependent effects of
ischaemia and atorvastatin on
I
Na
.
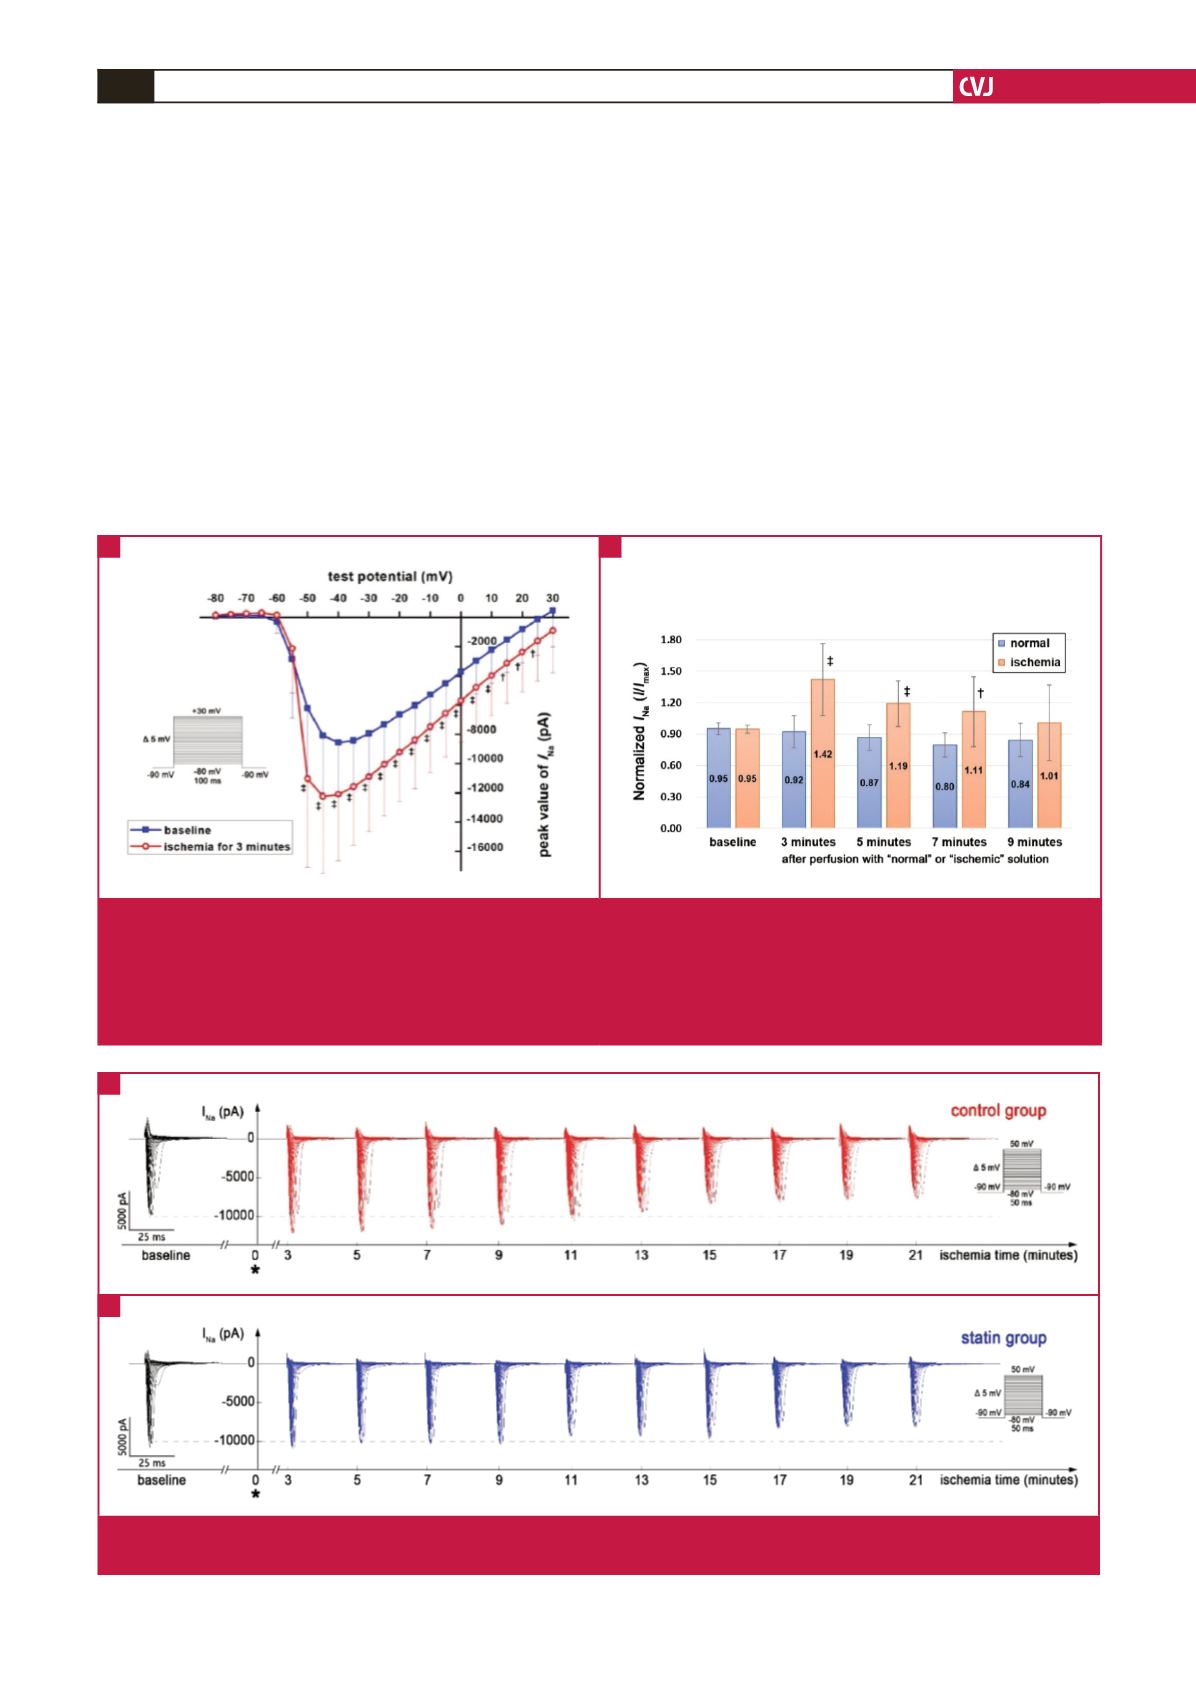
In the control group, the normalised
I
Na
increased above
baseline in the first three to seven minutes of simulated ischaemia,
and peaked at three minutes (Figs 3A, 4). Compared with the
three-minute point, the normalised
I
Na
decreased at seven minutes
(
p
=
0.0321). At the nine- and 11-minute points, the normalised
I
Na
returned to baseline (
p
=
0.3209 and 0.5505, respectively). With
the recording time extended, the normalised
I
Na
was lower than
baseline (
p
<
0.05) and gradually decreased from 13 to 21 minutes
(13 vs 15 minutes,
p
=
0.0270; 15 vs 17 minutes,
p
=
0.0146; 19 vs
21 minutes,
p
=
0.0014, respectively; Fig. 4).
In the statin group, the normalised
I
Na
gradually decreased
during the whole time of simulated ischaemia. It decreased by
0.09
±
0.03 mA at five minutes compared with baseline (
p
=
0.0163), decreased by 0.08
±
0.03 mA at 13 minutes compared
with five minutes (
p
=
0.0256), and continued decreasing by 0.09
±
0.02 mA (
p
=
0.0040) at 21 minutes compared with 13 minutes
(Fig. 4).
Comparing normalised
I
Na
between the two groups (Fig. 4),
there were no differences at baseline and 11 to 19 minutes of
ischaemia (
p
>
0.05). Normalised
I
Na
in the statin group was
lower than in the control group at three to nine minutes of
ischaemia (
p
<
0.05), while at 21 minutes,
I
Na
in the statin group
was higher than in the control group (
p
<
0.05).
Fig. 1.
Effects of ischaemia on
I
Na
in the very early stage after perfusion. (A) Current–voltage (I–V) curves between baseline and
ischaemia. When ventricular myocytes were perfused with ischaemic solution, the peak value of
I
Na
was voltage-dependently
increased in the stage of ischaemia after three minutes. Compared with baseline,
†
p
<
0.05,
‡
p
<
0.01. (B) Normalised
I
Na
after perfusion with normal and ischaemic extracellular solution. In the first 10 minutes after perfusion, normalised
I
Na
was
transiently increased when perfused with ischaemic solution, whereas there was little change when perfused with normal
solution, which excluded the effects of mechanical action on
I
Na
. Compared with normal solution,
†
p
<
0.05,
‡
p
<
0.01.
A
B
Fig. 2.
Trend of whole-cell currents of
I
Na
over time. (A) Whole-cell currents in the control group. (B) Whole-cell currents in the statin
group. *zero point of simulated ischaemia.
A
B


