
CARDIOVASCULAR JOURNAL OF AFRICA • Volume 30, No 5, September/October 2019
272
AFRICA
that
I
Na
was gradually attenuated over time after 10 minutes
of simulated ischaemia, which was consistent with previous
reports.
14
A possible reason may be the secondary damage to cells
by secondary calcium overload related to increased intracellular
sodium concentration.
15
The aconitine model has shown
16,17
that the abnormally
increased
I
Na
may result in the increase of 0 phase amplitude
of the action potential. As the increased action potentials pass
into the adjacent tissue in the relative refractory period, it will
cause threshold stimulation, which may lead to premature
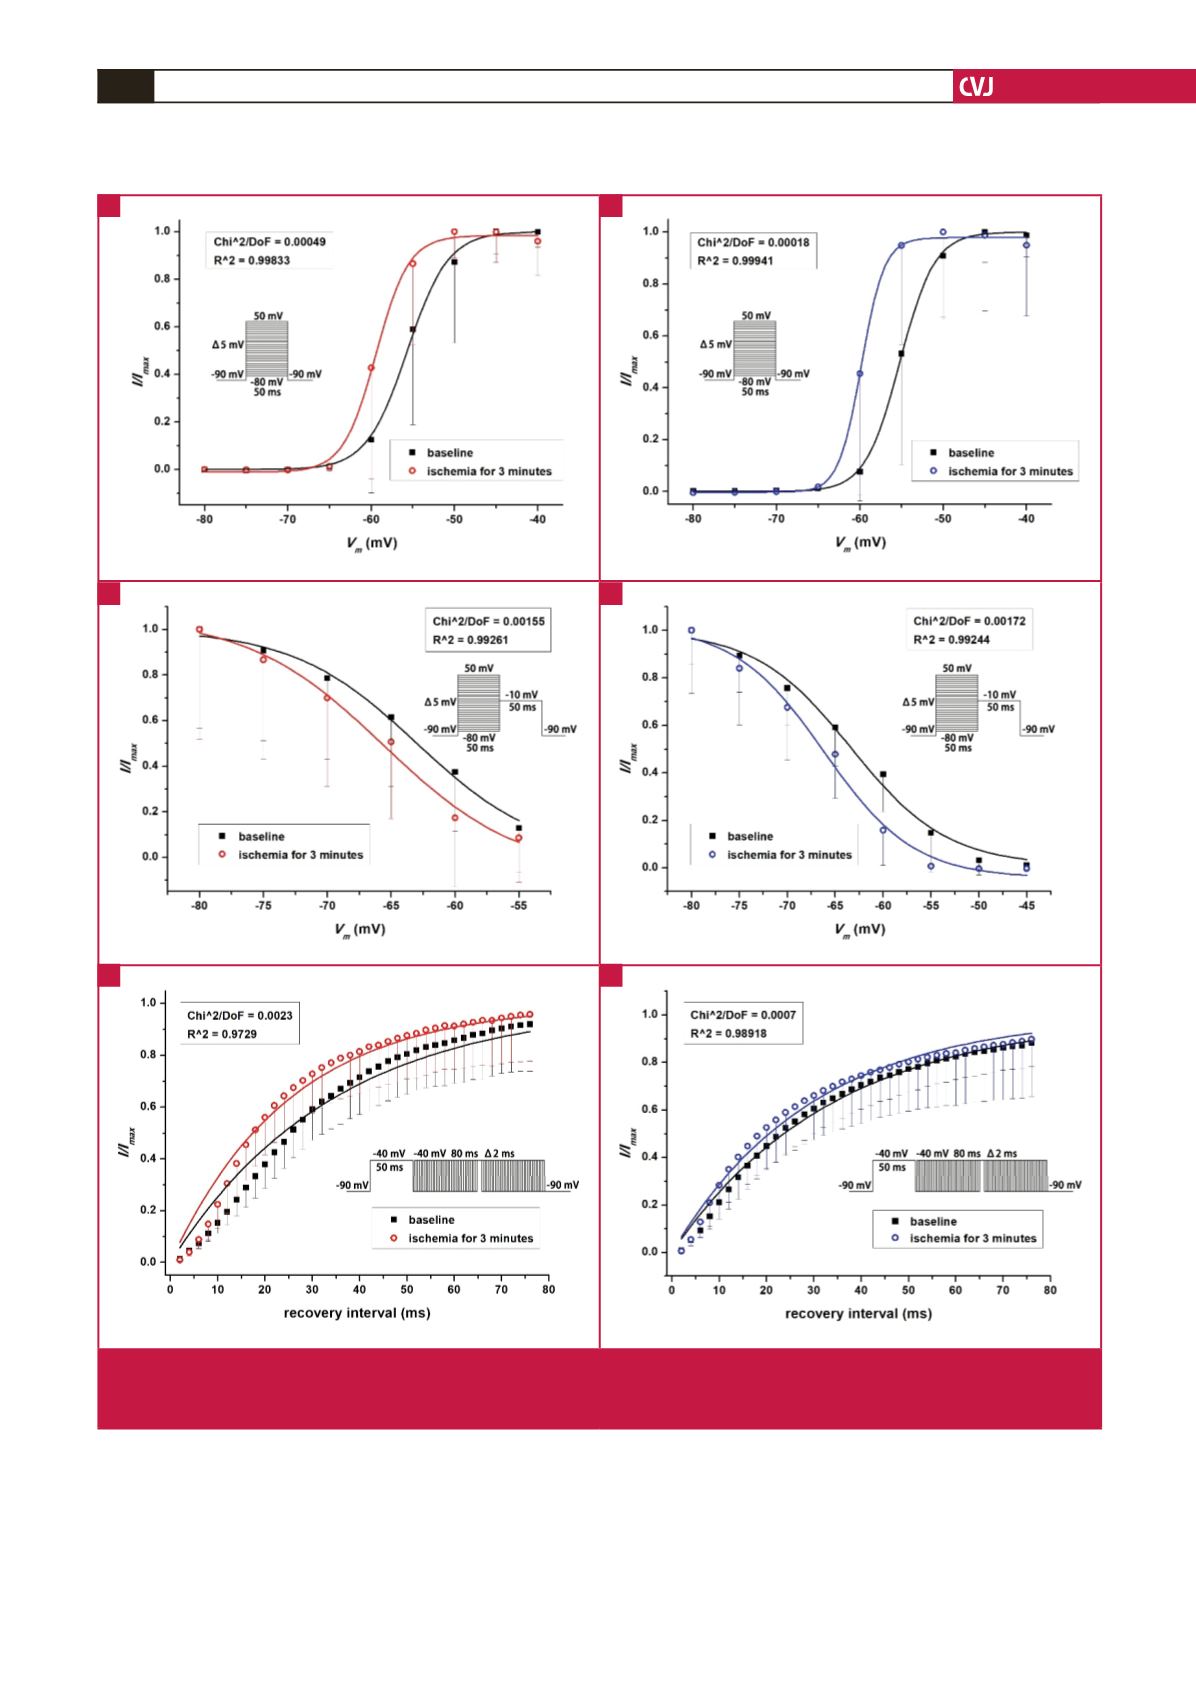
Fig. 5.
Gating characteristic curves between baseline and ischaemia for three minutes. (A) Activation curve in the control group. (B)
Activation curve in the statin group. (C) Inactivation curve in the control group. (D) Inactivation curve in the statin group. (E)
Recovery curve in the control group. (F) Recovery curve in the statin group.
A
C
E
B
D
F


