
CARDIOVASCULAR JOURNAL OF AFRICA • Volume 30, No 5, September/October 2019
AFRICA
271
Table 1 shows the gating characteristics of the two groups.
Compared with baseline, in the three minutes of simulated
ischaemia, the curves of activation and inactivation were shifted
negatively (Fig. 5A–D), and
K
a
and
τ
were decreased in both
groups (Table 1, Fig. 5A, B, E, F). At three minutes of simulated
ischaemia,
K
i
in the statin group was lower than in the control
group (
p
<
0.05), and
τ
in the statin group was higher than in the
control group (
p
<
0.05; Table 1, Fig. 5C–F).
Discussion
Sodium current plays an important role in ischaemic ventricular
arrhythmias, which may affect cardiac conductivity and
irritation.
3
Previous studies have shown that sodium current may
decrease in the ischaemic state,
5
but in our study, the current
transiently increased in the early stage of ischaemia. Ventricular
arrhythmias mainly appear in acute myocardial ischaemia in two
time periods after birth (0–0.5 and 1.5–9 hours).
12
In view of the relationship between ischaemic time and
the degree of injury, we hypothesised that the change of
I
Na
in
simulated ischaemia may be time-dependent. To observe the
instantaneous change in
I
Na
, the measurement time interval
was shortened to two minutes. The results showed that
I
Na
was
transiently increased and peaked at three minutes after simulated
ischaemia. At this time, the
V
1/2,a
and
V
1/2,i
were both decreased,
which represented the activation and inactivation thresholds,
respectively, and meant that both the activation and inactivation
processes would be much easier at the early stage of ischaemia.
In addition, decreased
K
a
and
τ
indicated that the processes of
channel activation and recovery had been changed much faster
(Fig. 5).
In summary, these changed gating characteristics indicated
that channel transition between open and closed states became
more frequent, and the open probability of sodium channels
per unit time had been increased. Since
I
m
=
i P
0
N
(where
I
m
is the whole-cell current,
i
is the single-channel current,
P
0
is
the open probability, and
N
is the number of channels),
13
the
whole-cell
I
Na
had been consequently increased at three minutes
of simulated ischaemia. However, this experiment also showed
Fig. 4.
Time trend of normalised
I
Na
at –40-mV test potential.
When entering the simulated ischaemic stage, the
normalised
I
Na
in the control group was transiently
increased during the first three to seven minutes, and
then attenuated rapidly, while in the statin group, the
normalised
I
Na
gradually decreased during the whole
of the simulated ischaemia.
Fig. 3.
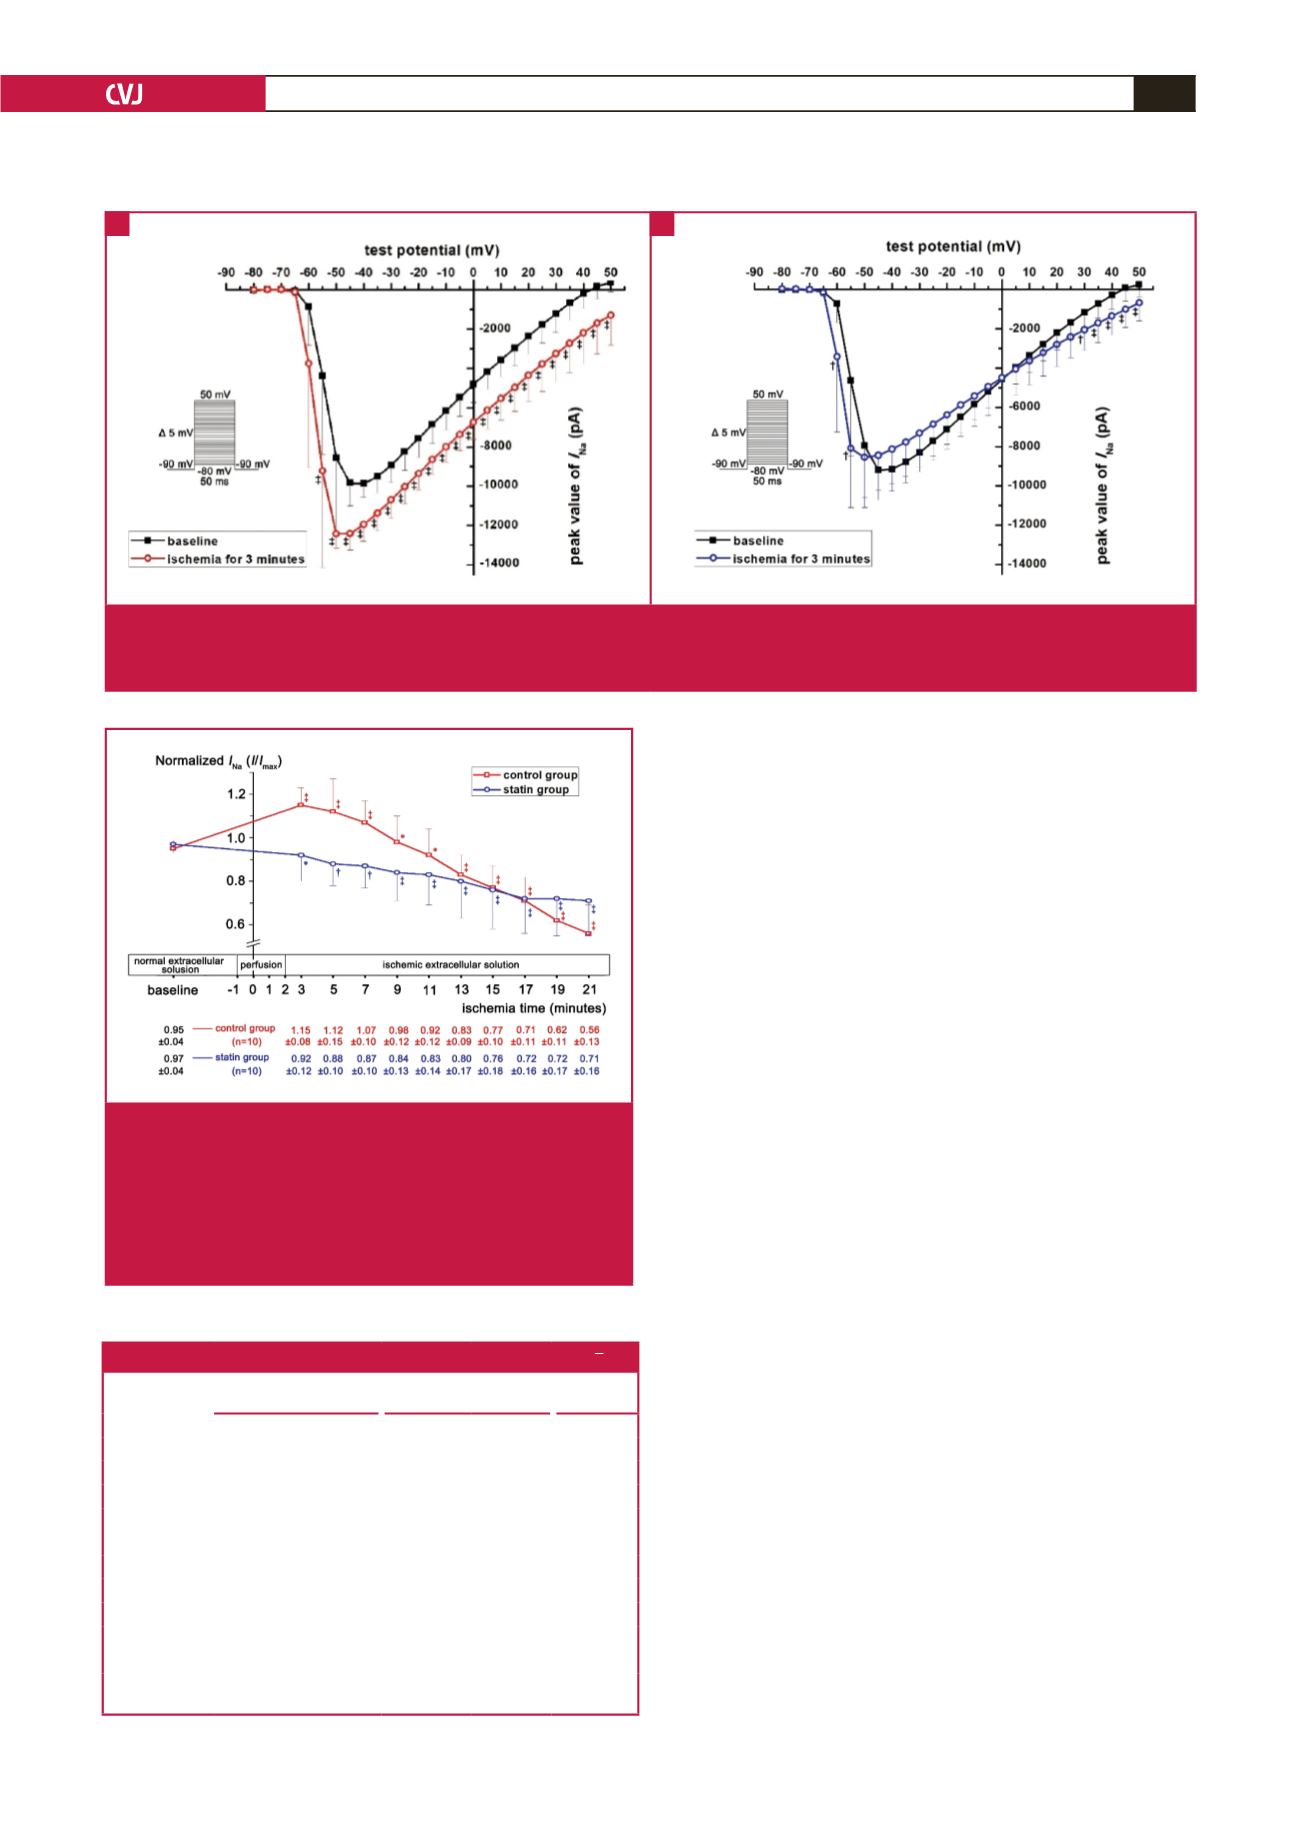
Current–voltage (I–V) curves between baseline and ischaemia for three minutes. (A) I–V curve of control group, which was
down-shifted in the very early stage of ischaemia, and represented the increase of
I
Na
at the test potential from –55 to 50 mV.
(B) I–V curve of statin group, which was little changed in the early ischaemic condition, compared to the baseline.
A
B
Table 1. Gating characteristics at three minutes of simulated ischaemia (
x
±
s
)
Activation (
n
=
8)
Inactivation (
n
=
8)
Resurrection
(
n
=
9)
V
1/2,a
(mV)
K
a
(mV)
V
1/2,i
(mV)
K
i
(mV)
τ
(ms)
Control group
Baseline (A
1
) –54.91
±
4.22 1.45
±
0.48 –62.84
±
2.50 4.52
±
0.97 34.23
±
4.40
Ischaemia (B
1
) –58.82
±
3.65 0.90
±
0.31 –65.19
±
3.33 4.28
±
1.11 25.54
±
6.41
Value of B
1
–A
1
–3.90
±
2.16 –0.55
±
0.44 –2.35
±
1.71 –0.23
±
0.38 –8.69
±
4.75
p
(A
1
:B
1
)
0.0014
0.0090
0.0061
0.1238
0.0006
Statin group
Baseline (A
2
) –54.70
±
3.54* 1.41
±
0.65* –63.33
±
2.24* 4.92
±
0.55* 34.58
±
8.55*
Ischemia (B
2
) –59.16
±
3.53 1.03
±
0.58 –66.45
±
1.91 4.12
±
0.56 30.22
±
9.65
Value of B
2
–A
2
–4.47
±
1.97 –0.38
±
0.35 –3.12
±
1.00 –0.81
±
0.35
†
–4.36
±
4.82
†
p
(A
2
:B
2
)
0.0004
0.0169
0.0000
0.0004
0.0263
Compared with the baseline of the control group, *
p
>
0.2, and compared with the
value of B
1
–A
1
,
†
p
<
0.05.


