
CARDIOVASCULAR JOURNAL OF AFRICA • Volume 30, No 5, September/October 2019
282
AFRICA
A total of 76 patients (54.3%) were maintained on 75 mg
Q2W for the duration of the study, while titration of alirocumab
dose from 75 mg Q2W to 150 mg Q2W occurred in 64 (45.1%)
patients. Down-titration to 75 mg Q2W occurred in six patients
(6.6%), either due to adverse events or at the discretion of
the investigator due to low LDL-C values. Compliance with
alirocumab was recorded as 98.2% during the OLE study.
Nine deaths were recorded during the study: five due to
cardiovascular causes (acute myocardial infarction, heart failure
and other) and four due to non-cardiovascular causes (Table 5).
Eight patients reported injection-site reactions with one treatment
discontinuation. Treatment emergent anti-drug antibodies were
identified in five patients (three persistent, two transient) but these
were non-neutralising and did not affect the efficacy (Table 6).
Discussion
HeFH remains a challenging condition to manage effectively.
The safety and efficacy of treatment with alirocumab in patients
with HeFH have been reported in previous phase 3 studies.
8-10
However, while these studies were conducted over a period of
78 weeks, the long-term safety of treatment with alirocumab in
this patient population had not previously been investigated. The
ODYSSEY OLE study provides data on a further 144 weeks of
treatment with open-label alirocumab.
The South African arm of the ODYSSEY OLE study
confirmed the safety, tolerability and sustained, persistent, long-
term reduction of LDL-C levels in South African patients with
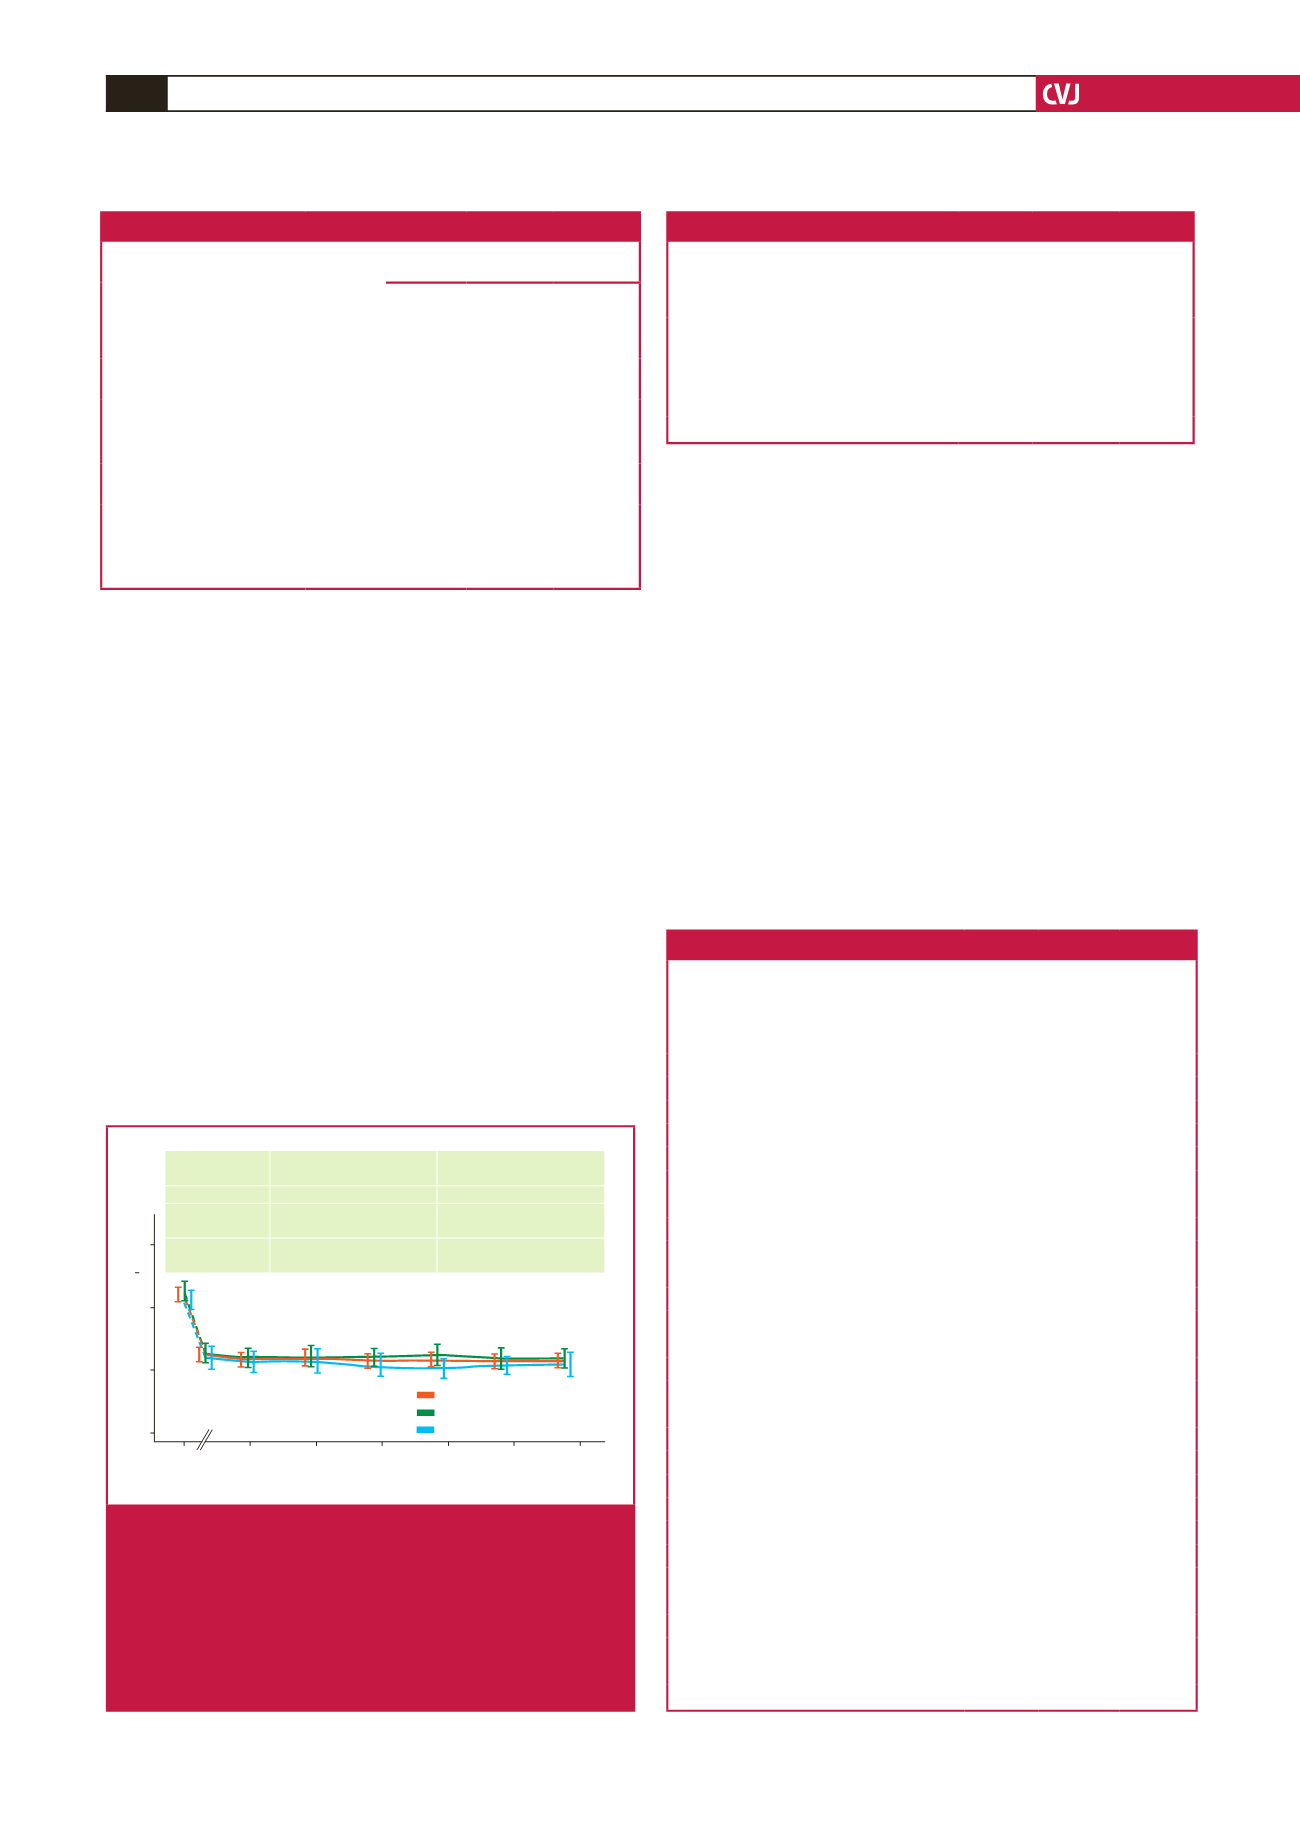
HeFH. The LDL-C reduction observed in the South African arm
of the OLE study at week 144 was 48.7%, mimicking the reported
LDL-C reduction in the parent studies as well as the LDL-C
reduction observed in the global OLE study (47.9% at week 96).
13
The global ODYSSEY OLE study enrolled a total of 985
patients diagnosed with HeFH. At baseline, 977 (99.2%) patients
were on treatment with statins, while 571 (58.0%) patients
Table 5. Primary cause of deaths as per investigator’s reports
Variables
Placebo
in parent
study
(
n
=
62)
Alirocumab
in parent
study
(
n
=
105)
All
(
n
=
167)
Death on study,
n
(%)
4 (6.5)
5 (4.8)
9 (5.4)
Any cardiovascular event,
n
(%)
Acute myocardial infarction,
n
(%)
Heart failure or cardiogenic shock,
n
(%)
Other cardiovascular causes,
n
(%)
2 (3.2)
0
1 (1.6)
1 (1.6)
3 (2.9)
2 (1.9)
1 (1.0)
0
5 (3.0)
2 (1.2)
2 (1.2)
1 (0.6)
Non-cardiovascular event,
n
(%)
2 (3.2)
2 (1.9)
4 (2.4)
Table 6. Adverse events and safety laboratory values (safety population)
Adverse event
Placebo
in parent
study
n
(%)
(
n
=
62)
Alirocumab
in parent
study
n
(%)
(
n
=
105)
All, n
(%)
(
n
=
167)
Treatment-emergent adverse events (TEAE) 58 (93.5) 98 (93.3) 156 (93.4)
Treatment-emergent serious adverse events 29 (46.8) 30 (28.6) 59 (35.5)
TEAEs leading to death
4 (6.5)
5 (4.8)
9 (5.4)
TEAEs leading to permanent discontinuation 5 (8.1)
9 (8.6)
14 (8.4)
Death
4 (6.5)
5 (4.8)
9 (5.4)
TEAEs occurring in
≥
5% in either group
Gastroenteritis
5 (8.1)
12 (11.4) 17 (10.2)
Dental and oral soft tissue infections
4 (6.5)
8 (7.6)
12 (7.2)
Tooth abscess
3 (4.8)
8 (7.6)
11 (6.6)
Bronchitis
6 (9.7)
10 (9.5)
16 (9.6)
Upper respiratory tract infection
8 (12.9) 21 (20.0) 29 (17.4)
Urinary tract infection
9 (14.5)
7 (6.7)
16 (9.6)
Influenza
9 (14.5) 15 (14.3) 24 (14.4)
Viral upper respiratory tract infection
5 (8.1)
9 (8.6)
14 (8.4)
Headache
2 (3.2)
7 (6.7)
9 (5.4)
Angina pectoris
4 (6.5)
4 (3.8)
8 (4.8)
Hypertension
6 (9.7)
5 (4.8)
11 (6.6)
Hiatus hernia
4 (6.5)
1 (1.0)
5 (3.0)
Gastritis
4 (6.5)
6 (5.7)
10 (6.0)
Diarrhoea
2 (3.2)
6 (5.7)
8 (4.8)
Arthralgia
6 (9.7)
10 (9.5)
16 (9.6)
Osteoarthritis
5 (8.1)
4 (3.8)
9 (5.4)
Muscle spasms
3 (4.8)
6 (5.7)
9 (5.4)
Back pain
2 (3.2)
6 (5.7)
8 (4.8)
Pain in extremity
1 (1.6)
7 (6.7)
8 (4.8)
Injection-site reaction
2 (3.2)
6 (5.7)
8 (4.8)
Fatigue
4 (6.5)
1 (1.0)
5 (3.0)
Influenza-like illness
2 (3.2)
7 (6.7)
9 (5.4)
Table 4. Lipid parameters at baseline of the parent and ODYSSEY OLE studies
Baseline
at start
of parent
study
(
n
=
167)
Baseline at the start of
ODYSSEY OLE study
Lipid parameters
Placebo
in parent
study
(
n
=
62)
Alirocumab
in parent
study
(
n
=
105)
All patients
included in
OLE study
(
n
=
167)
Calculated LDL-C (mmol/l),
mean (SD)
4.39 (1.56) 4.50 (1.60) 3.14 (1.96) 3.65 (1.95)
Non-HDL-C (mmol/l), mean
(SD)
5.10 (1.64) 5.35 (1.68) 3.89 (2.09) 4.44 (2.07)
HDL-C (mmol/l), mean (SD) 1.24 (0.35) 1.28 (0.40) 1.32 (0.38) 1.31 (0.39)
Total cholesterol (mmol/l),
mean (SD)
6.3 (1.59) 6.63 (1.60) 5.22 (2.01) 5.75 (1.98)
Fasting triglycerides
(mmol/l), mean (SD)
1.53 (0.78) 1.74 (1.14) 1.56 (0.78) 1.63 (0.93)
Lipoprotein (a) (nmol/l),
mean (SD)
101.75
(103.3)
106.7
(118.75)
89.5 (87) 91.5 (99.5)
Time (weeks)
Mean calculated LDL-C (mmol/l)
0 25 50 75 100 125 150
6
4
2
0
Absolute LDL-C
reduction at week 144
Mean % LDL-C
reduction at week 144
All patients
2.26
±
1.51
–48.7
±
24.1
Alirocumab in
parent study
2.47
±
1.63
–49.9
±
23.9
Placebo in
parent study
1.90
±
1.21
–46.6
±
24.5
Alirocumab
Alirocumab in parent study
Placebo in parent stydy
Fig. 2.
Reduction in LDL-C levels observed over the 144-week
study period, indicating alirocumab during the parent
study, placebo during the parent study or entire
ODYSSEY OLE cohort, irrespective of treatment
stratification in the parent studies. Note that change
in LDL-C level from the baseline of the parent study to
the start of the OLE study is indicated as dotted lines
based on the mITT analysis.


