


 15 / 68

CARDIOVASCULAR JOURNAL OF AFRICA • Volume 31, No 2, March/April 2020
AFRICA
67
All subjects had grade A oesophagitis in both the ACS and
the GORD group. There was no chest pain on acid instillation
among the subjects with isolated GORD and the controls. Mild
retrosternal chest pain developed in two subjects in the ACS
group but this was short lived and did not require nitroglycerin,
nor was it associated with ECG changes.
During acid installation, ECG recording showed 8/39 (20.5%)
subjects in the ACS group developed ST depression indicative
of ischaemia, compared to 5/20 (25%) patients with GORD,
and none of the controls (Fig. 2). There was no difference in
the prevalence of ST depression occurring with acid instillation
(Table 3) in the ACS compared to the GORD patients (
p
=
0.958). The odds ratio of developing ST changes after acid
installation in ACS compared to GORD patients was 1.06 (95%
CI: 0.3166–3.5411,
p
=
0.9261).
Baseline characteristics were similar in subjects with and
without ST depression. Significant ventricular arrhythmias
(Lown grade 4) were recorded in one subject in the ACS group
during acid instillation compared to none in the GORD subjects
(Table 4) (
p
=
0.001). This patient did not have ST changes
indicative of ischaemia.
Discussion
It is estimated that about 30% of subjects undergoing coronary
angiography in the USA have normal epicardial coronary
arteries and in these individuals, oesophageal diseases may
account for the symptoms in 18 to 56%.
14
Chest pain arising from
the oesophagus may be indistinguishable from angina pectoris,
since patients may present with similar symptoms and only
subtle differences.
The clinical history does not always enable a physician to
distinguish accurately between cardiac and oesophageal causes
of chest pain. Symptoms suggestive of cardiac ischaemia are
typically effort-induced pain that radiates to the arm and is
Table 2. Demographic data and baseline risk-factor profile
ACS
GORD
Control
p
-value
F
(n
=
9
)
M
(
n
=
30)
Total
(n
=
39
)
F
(n
=
15
)
M
(n
=
5
)
Total
(n
=
20
)
F
(n
=
14
)
M
(n
=
8
)
Total
(n
=
22
)
ACS vs
GORD
GORD
vs control
ACS
vs control
Age
52
51
52
±
9
49
49
49
±
12
48
44
46
±
12
0.651
0.002
0.266
Waist (cm)
93.3
93.7 94.0
±
1.9 94.9
99.5 96.0
±
1.8 85.7
78.9 83.5
±
9.1
0.702
0.030
0.002
Waist/hip
0.93
1.0 0.9
±
0.1 0.9
0.9
0.90
0.8
0.9
0.90
0.037
0.030
<
0.001
BMI (kg/m
2
)
26.1
24.2 24.7
±
4.0 29.3
25.8 28.4
±
5.5 26.3
21.0 24.4
±
4.5
0.009
0.014
0.974
Diabetes
6 (15.4) 11 (28.2) 17 (43.6)
1 (5.0)
1 (5.0)
2 (10)
0
0
0
0.001
0.597
0.031
Hypertension
5 (13.0) 12 (30.1) 17 (43.6)
1 (5.0)
0
1 (5)
0
0
0
0.002
0.294
<
0.001
History of smok-
ing
3 (7.7)
17 (43.6) 20 (51.2) 3 (15.0)
3 (15.0)
6 (30.0)
2 (9.0)
3 (13.6)
5 (22.7)
0.006
0.133
<
0.001
SBP (mmHg)
122
123 123
±
15.7 117
123 117
±
11.7 117
113 120
±
11.0
0.198
0.661
0.706
DBP (mmHg)
74
74
74
±
9.3
71
75
65
±
6.0
70
69
64
±
5.0
<
0.001
0.917
<
0.001
Plasma glucose
(mmol/l)
5.8
8.7 7.9
±
3.4 4.3
5.2 4.5
±
0.61 4.3
4.3
4.3
±
0.4
<
0.001
0.972
<
0.001
Serum cholesterol
(mmol/l)
6.9
5.0 5.9
±
2.5 5.1
4.9
5.1
±
0.9
5.0
4.0
4.3
±
0.5
0.296
0.325
0.010
Serum HDL-C
(mmol/l)
1.0
1.0 0.9
±
0.2 1.1
1.1
1.1
±
0.2
1.3
1.6
1.4
±
0.6
0.068
0.087
<
0.001
Serum LDL-C
(mmol/l)
2.6
3.0 3.0
±
1.2 2.3
2.2
2.2
±
0.7
2
1.6
1.8
±
0.5
0.176
0.121
0.028
Serum triglycer-
ides (mmol/l)
2.2
1.7 2.0
±
0.3 1.4
1.2
1.4
±
0.2
1.0
1.0
1.0
±
0.9
0.008
0.119
<
0.001
ACS, acute coronary syndrome; GORD, gastro-oesophageal disease; F, female; M, male; SBP, systolic blood pressure; DBP, diastolic blood pressure; HDL-C,
high-density lipoprotein cholesterol; LDL-C, low-density lipoprotein cholesterol. Figures in brackets denote percentages.
Table 3. ST changes after acid instillation
ST depression
ACS
(n
=
39)
GORD
(n
=
20)
Control
(n
=
22)
ACS vs GORD
p-value
Female,
n
(%)
3 (7.7)
4 (20)
0
Male,
n
(%)
5 (12.8)
1 (5)
0
Total,
n
(%)
8 (20.5)
5 (25)
0
0.958
Compared to the controls, ST changes were more frequently recorded in ACS
(
p
=
0.010) and GORD (
p
=
0.014) subjects. No differences were observed in ST
changes between ACS and GORD (
p
=
0.958) subjects.
ACS, acute coronary syndrome; GORD, gastro-oesopheageal reflux disease.
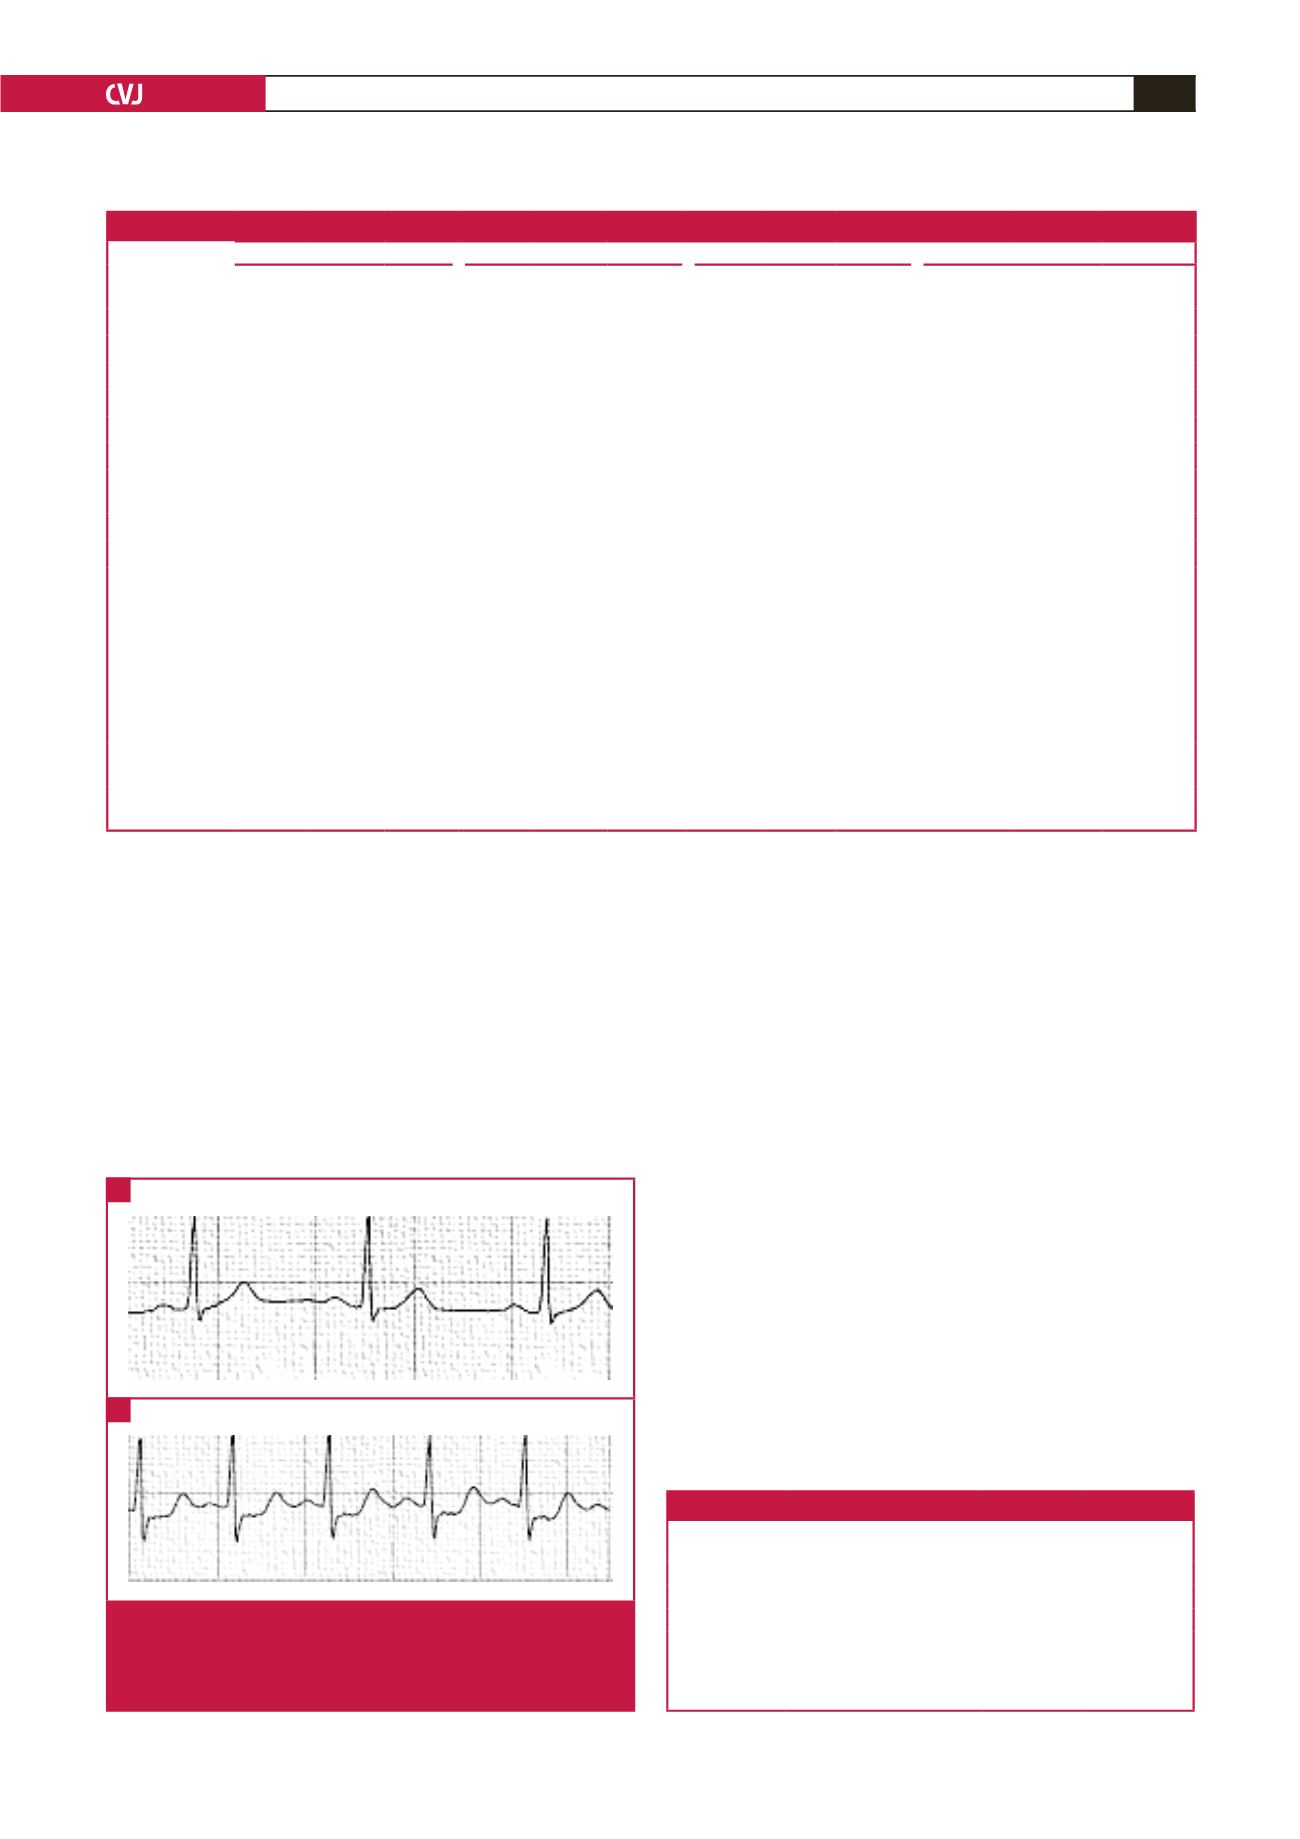
Fig. 2.
ST changes induced by acid instillation in an ACS
patient. Normal baseline ECG (A) followed by horizon-
tal ST depression (B). There was no accompanying
chest pain.
A
B