
CARDIOVASCULAR JOURNAL OF AFRICA • Volume 31, No 3, May/June 2020
AFRICA
119
DBP were significantly higher in the LE than the AE group, but
there were no differences observed in SBP.
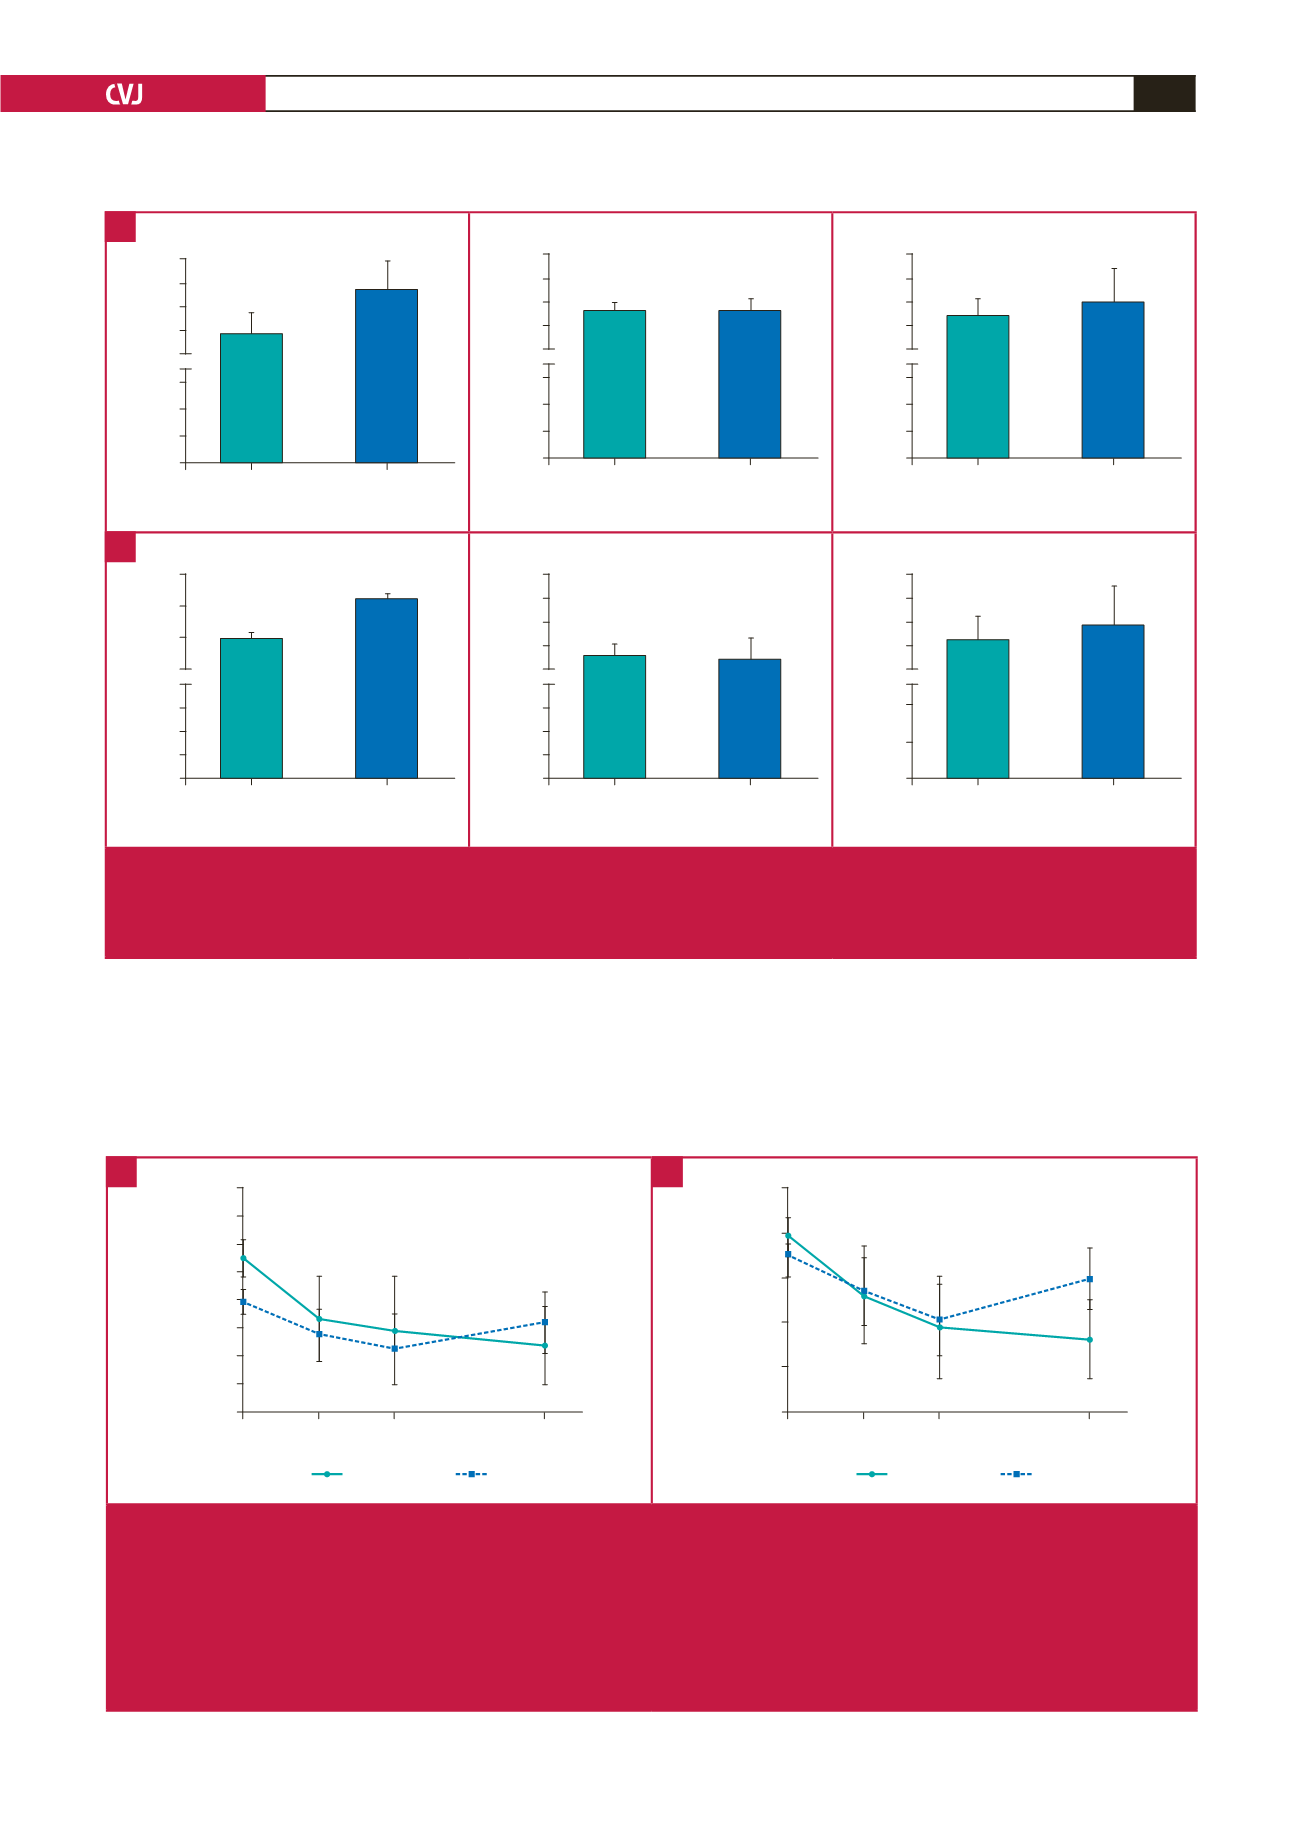
Fig. 2 shows the values of SBP (A) and DBP (B) during the
daytime, night-time and total 24 hours (daytime plus night-time).
The AE group showed lower values for daytime SBP (124
±
4
mmHg) and DBP (70
±
3 mmHg) than the LE group (SBP: 134
±
6 mmHg, DBP: 76
±
4 mmHg), as well as for the 24-hour average
for SBP (AE: 121
±
5 mmHg vs LE: 125
±
10 mmHg). There was
no difference between the groups during the night-time or for the
24-hour average of DBP.
AE
LE
SBP daytime
mmHg
140
135
130
125
120
60
40
20
0
*
AE
LE
SBP night-time
mmHg
140
135
130
125
120
60
40
20
0
AE
LE
SBP 24-h average
mmHg
140
135
130
125
120
60
40
20
0
&
AE
LE
DBP daytime
mmHg
80
75
70
65
40
30
20
10
0
#
AE
LE
DBP night-time
mmHg
80
75
70
65
60
40
30
20
10
0
AE
LE
DBP 24-h average
mmHg
80
75
70
65
60
40
20
0
Fig. 2.
Average SPB (A) and DBP (B) during the daytime, night-time, and over 24 hours. AE: aquatic exercise; LE: land exercise
*
p
< 0.0001 when compared with AE, SPB daytime (AE 124
±
4 mmHg, LE 134
±
6 mmHg) ;
#
p
< 0.0001 when compared
with AE, DPB daytime (AE 70
±
3 mmHg vs LE 76
±
4 mmHg);
&
p
< 0.02 when compared with AE, SPB 24 hours (AE 121
±
5 mmHg vs LE 125
±
10 mmHg)
A
B
a
SBP PEH
0-h
2-h
12-h
24-h
mmHg
180
170
160
150
140
130
120
110
100
a,b
a
AE-PEH
LE-PEH
a
DBP PEH
0-h
2-h
12-h
24-h
mmHg
100
90
80
70
60
50
a,b
a,*
AE-PEH
LE-PEH
Fig. 3.
SBP (A) and DBP (B) PEH in the AE and LE groups at the second-, 12th- and 24th-hour time points. a: represents the
difference between AE-PEH baseline and the time points, b: represents the difference between LE-PEH baseline and the
time points, *represents the difference between the groups at the same time point. a:
p
< 0.001 when compared to AE-PEH
at 0 hours (SBP/DBP AE-PEH: baseline (0 h) 155
±
7/90
±
4 mmHg, second hour 133
±
15/76
±
11 mmHg, 12th hour 129
±
19/69
±
11 mmHg, 24th hour 123
±
14/66
±
9 mmHg); b:
p
< 0.03 when compared to LE-PEH at 0 hours (SBP/DPB LE-PEH:
baseline (0 h) 139
±
5/85
±
2 mmHg, 12th hour 122
±
9/71
±
8 mmHg); *
p
< 0.01 when compared with LE-PEH (DBP AE-PEH
66
±
9 mmHg, LE-PEH 80
±
7 mmHg). AE: aquatic exercise; LE: land exercise; PEH: post-exercise hypotension. Two-way
ANOVA with Bonferroni correction, data expressed as mean
±
SD. Interaction for SBP:
p
=
0.0544, DBP:
p
=
0.0099.
A
B


