


 12 / 64

CARDIOVASCULAR JOURNAL OF AFRICA • Volume 31, No 3, May/June 2020
120
AFRICA
Fig. 3 shows the PEH for SBP (A) and DBP (B) in the
AE-PEH and LE-PEH groups at the second, 12th and 24th
hours after the exercise session, those times being chosen because
the individuals were then awake. The AE-PEH data show that
PEH was maintained from the second to the 24th hour, while
for the LE group, maintenance of PEH was observed only until
the 12th hour. There was no difference in PEH at the second
and 12th hour between the groups, but for DBP, at the 24th
hour, AE-PEH values were lower (66
±
9 mmHg) than those of
LE-PEH (80
±
7 mmHg).
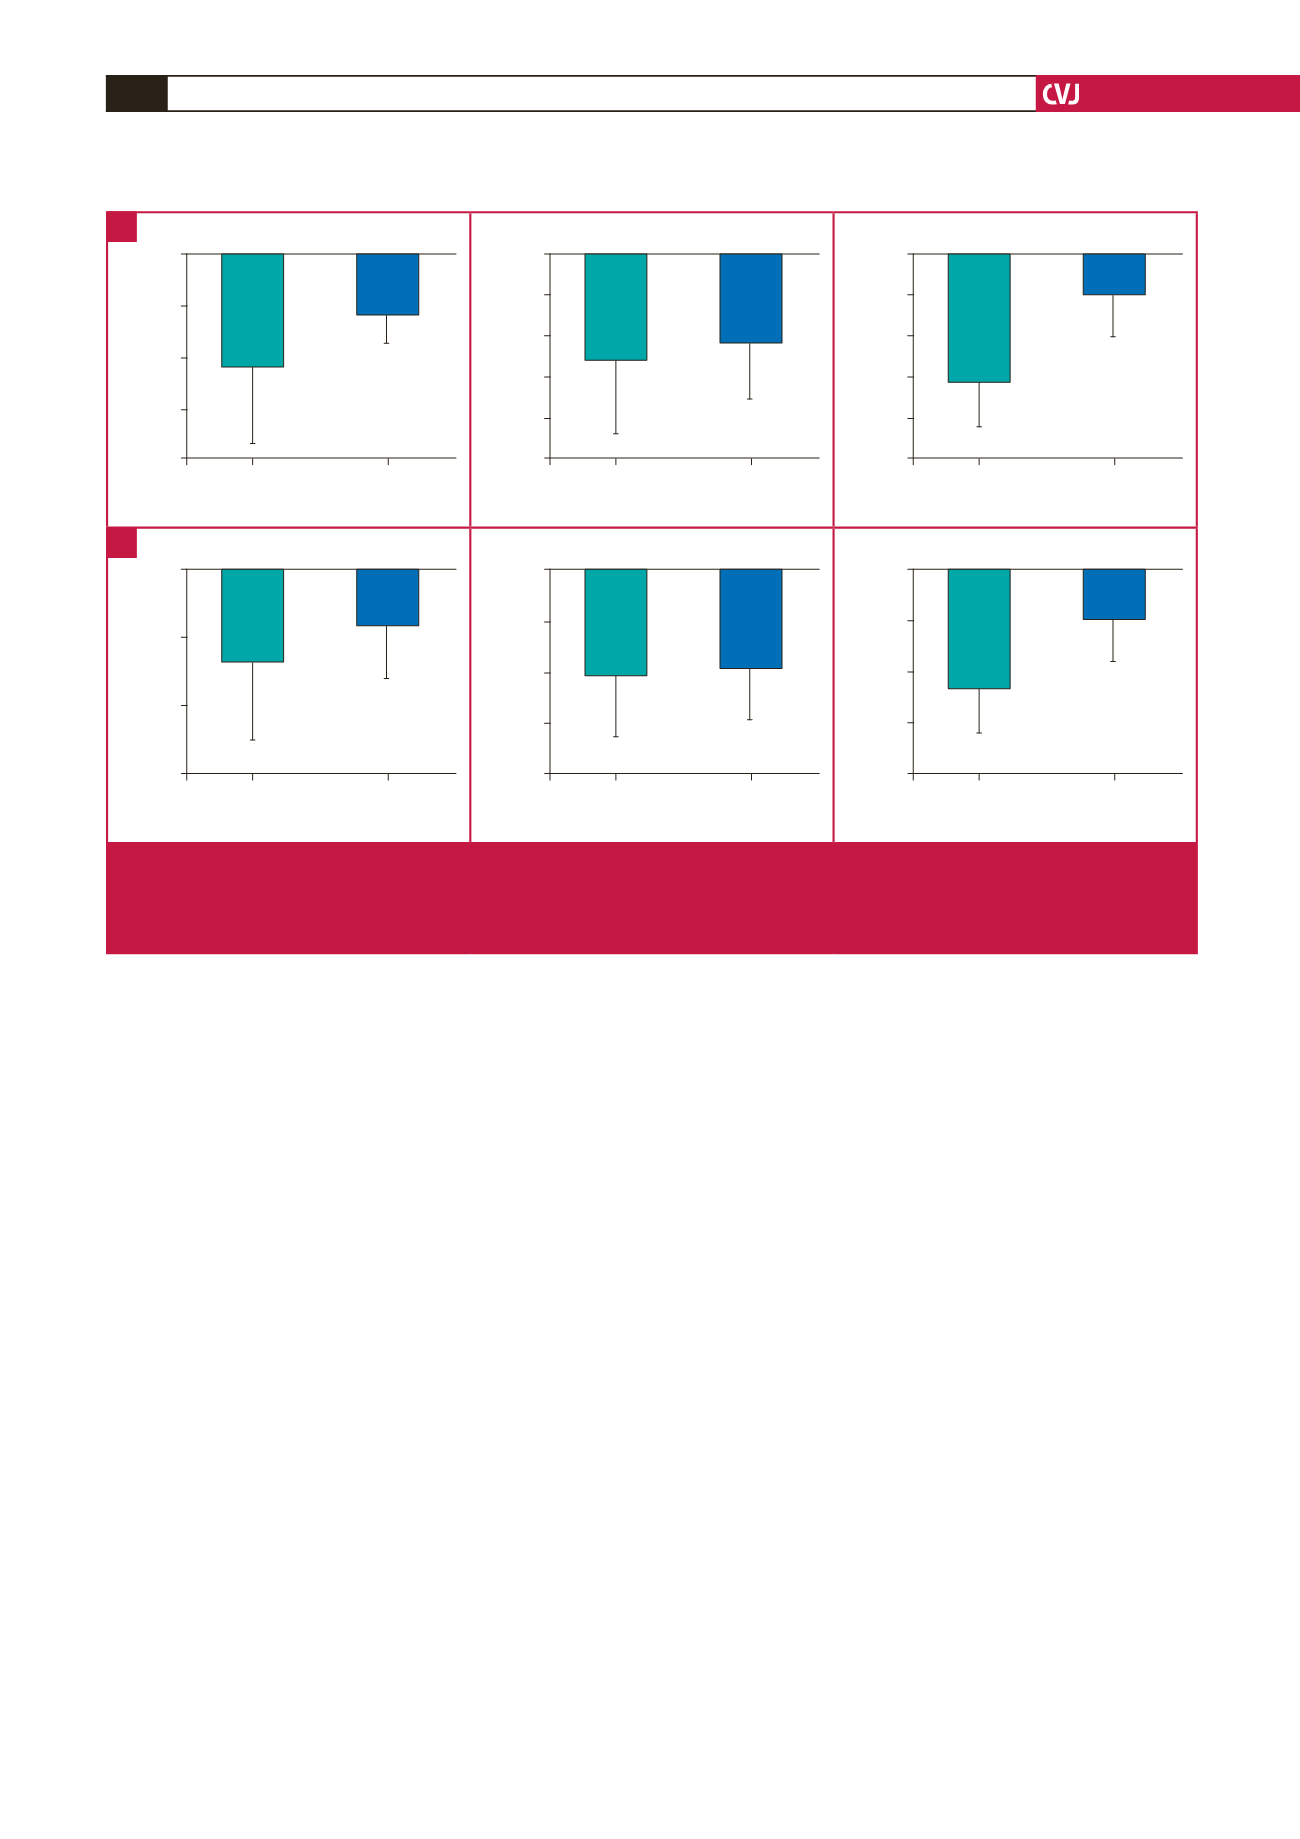
Fig. 4 shows SBP (A) and DBP (B) for the groups AE-PEH
and LE-PEH. There was no difference in PEH at the second
and 12th hours between the groups, but the 24th hour PEH was
higher for the AE group (SBP: −31
±
11 mmHg, DBP: −23
±
8
mmHg) than for the LE group (SBP: −10
±
10 mmHg, DBP:
−10
±
8 mmHg).
Discussion
The main finding of this study was that elderly hypertensive
subjects trained in AE had different baseline BP responses
from land-trained subjects. During the daytime, SBP and DBP
values were lower for aquatic-trained hypertensive subjects. In
addition, the PEH induced by AE was more rapid and lasted
longer than that induced by LE, based on data recorded 24 hours
after the exercise session. Another interesting result was the
cardiovascular response after a cardiopulmonary test: maximal
HR and DBP were higher for land-trained than aquatic-trained
subjects.
Both training environments have been shown to be efficacious
in reducing BP, but aquatic training caused a more impressive
reduction (−10.58 mmHg) than that due to land aerobic
training (−3.5 mmHg) or resistance training (−1.8 mmHg).
3
The baseline data show that AE induced lower BP values, an
effect appearing during the awake period, which could be due to
higher sympathetic tonus activity during the awake period than
at night, as data show that in the daytime there is a prevalence
of sympathetic tonus.
37
AE modulates the sympathetic drive differently from that
observed for LE. In AE, one should consider the effect of
hydrostatic pressure, which induces an increase in blood
concentration in the thorax
38
and reflexively decreases the heart
rate. Increased venous return during immersion stimulates
cardiopulmonary receptors, which decrease sympathetic activity
and total peripheral resistance.
39
Bradycardia also occurs
during immersion.
40
In addition, data reported in the literature
show that aquatic-based exercise induces a different response
associated with renal sympathetic nerve activity,
23
as well as
higher suppression of the vasopressin and renin–angiotensin
systems, from that of physical activities on land.
41,42
The maximal response to the cardiopulmonary test shows
that both groups had the same VO
2 max
, but, interestingly,
hypertensives trained in AE had lower HR and DBP during
maximal effort. The chronic effect of AE ameliorates arterial
peripheral resistance, and the decrease in levels of epinephrine,
norepinephrine and endothelin-1 associated with an increase in
nitric oxide levels can improve the BP response during exercise,
including DBP.
43
We found that elderly hypertensive subjects had
AE-PEH 2-h
LE-PEH 2-h
SBP PEH
mmHg
0
–10
–20
–30
–40
SBP PEH
AE-PEH 12-h LE-PEH 12-h
mmHg
0
–10
–20
–30
–40
–50
SBP PEH
AE-PEH 12-h LE-PEH 12-h
#
mmHg
0
–10
–20
–30
–40
–50
AE-PEH 2-h
LE-PEH 2-h
DBP PEH
mmHg
0
–10
–20
–30
DBP PEH
AE-PEH 12-h LE-PEH 12-h
mmHg
0
–10
–20
–30
–40
DBP PEH
AE-PEH 12-h LE-PEH 12-h
*
mmHg
0
–10
–20
–30
–40
Fig. 4.
Magnitude of PEH in the exercise groups AE-PEH and LE-PEH for SBP (A) and DBP (B) at the second, 12th and 24th
hour. PEH: post-exercise hypotension.
#
p
< 0.001 when compared with LE-PEH 24th hour (SBP AE-PEH –31
±
10 mmHg vs
LE-PEH –10
±
10 mmHg); *
p
< 0.01 when compared with LE-PEH 24th hour (DBP AE-PEH –23
±
9 mmHg vs LE-PEH –10
±
8 mmHg). Unpaired
t
-test with Welch’s correction, data expressed as mean
±
SD.
A
B