


 12 / 62

CARDIOVASCULAR JOURNAL OF AFRICA • Volume 31, No 4, July/August 2020
174
AFRICA
recovery in mitochondria from hearts reperfused after 25 minutes
of ischaemia. This was seen with both substrates.
Mitophagy
Fig. 5A depicts the expression of TOM70, p62, PINK1 and
Parkin in mitochondria isolated from rat hearts (with and
without chloroquine pre-treatment) at different times during
the perfusion protocol. To normalise the data, the same
mitochondrial sample isolated from an unperfused heart was
included in all Western blots. Interestingly, the stabilisation period
of 40 minutes significantly reduced and increased the expression
of TOM70 and PINK1, respectively, while not affecting p62
and Parkin. A similar stabilisation-induced reduction in total
QO
2
(S3)
AMC
STB
25
′
ISC
30
′
ISC
25
′
ISC + RP
30
′
ISC + RP
STB
25
′
ISC
30
′
ISC
25
′
ISC + RP
30
′
ISC + RP
Con
Con+CQ
300
200
100
0
nAtoms O/mg prot/min
*
*
p
≤
0.0004
p
≤
0.005
p
≤
0.001
QO
2
(S4)
AMC
STB
25
′
ISC
30
′
ISC
25
′
ISC + RP
30
′
ISC + RP
STB
25
′
ISC
30
′
ISC
25
′
ISC + RP
30
′
ISC + RP
Con
Con+CQ
100
80
60
40
20
0
nAtoms O/mg prot/min
*
p
≤
0.002
p
≤
0.001
p
≤
0.003
p
≤
0.001
p
≤
0.05
RCI
AMC
STB
25
′
ISC
30
′
ISC
25
′
ISC + RP
30
′
ISC + RP
STB
25
′
ISC
30
′
ISC
25
′
ISC + RP
30
′
ISC + RP
Con
Con+CQ
6
4
2
0
Ratio (S3/S4)
*
*
p
≤
0.001
p
≤
0.05
*
Ox-phos rate (S3)
AMC
STB
25
′
ISC
30
′
ISC
25
′
ISC + RP
30
′
ISC + RP
STB
25
′
ISC
30
′
ISC
25
′
ISC + RP
30
′
ISC + RP
Con
Con+CQ
500
400
300
200
100
0
nmoles ATP/mg prot/min
*
p
≤
0.05
p
≤
0.05
p
≤
0.002
Recovery after re-oxygenation
AMC
STB
25
′
ISC
30
′
ISC
25
′
ISC + RP
30
′
ISC + RP
STB
25
′
ISC
30
′
ISC
25
′
ISC + RP
30
′
ISC + RP
Con
Con+CQ
200
150
100
50
0
Recovery in %
*
p
≤
0.008
p
≤
0.05
p
≤
0.05
p
≤
0.03
p
≤
0.03
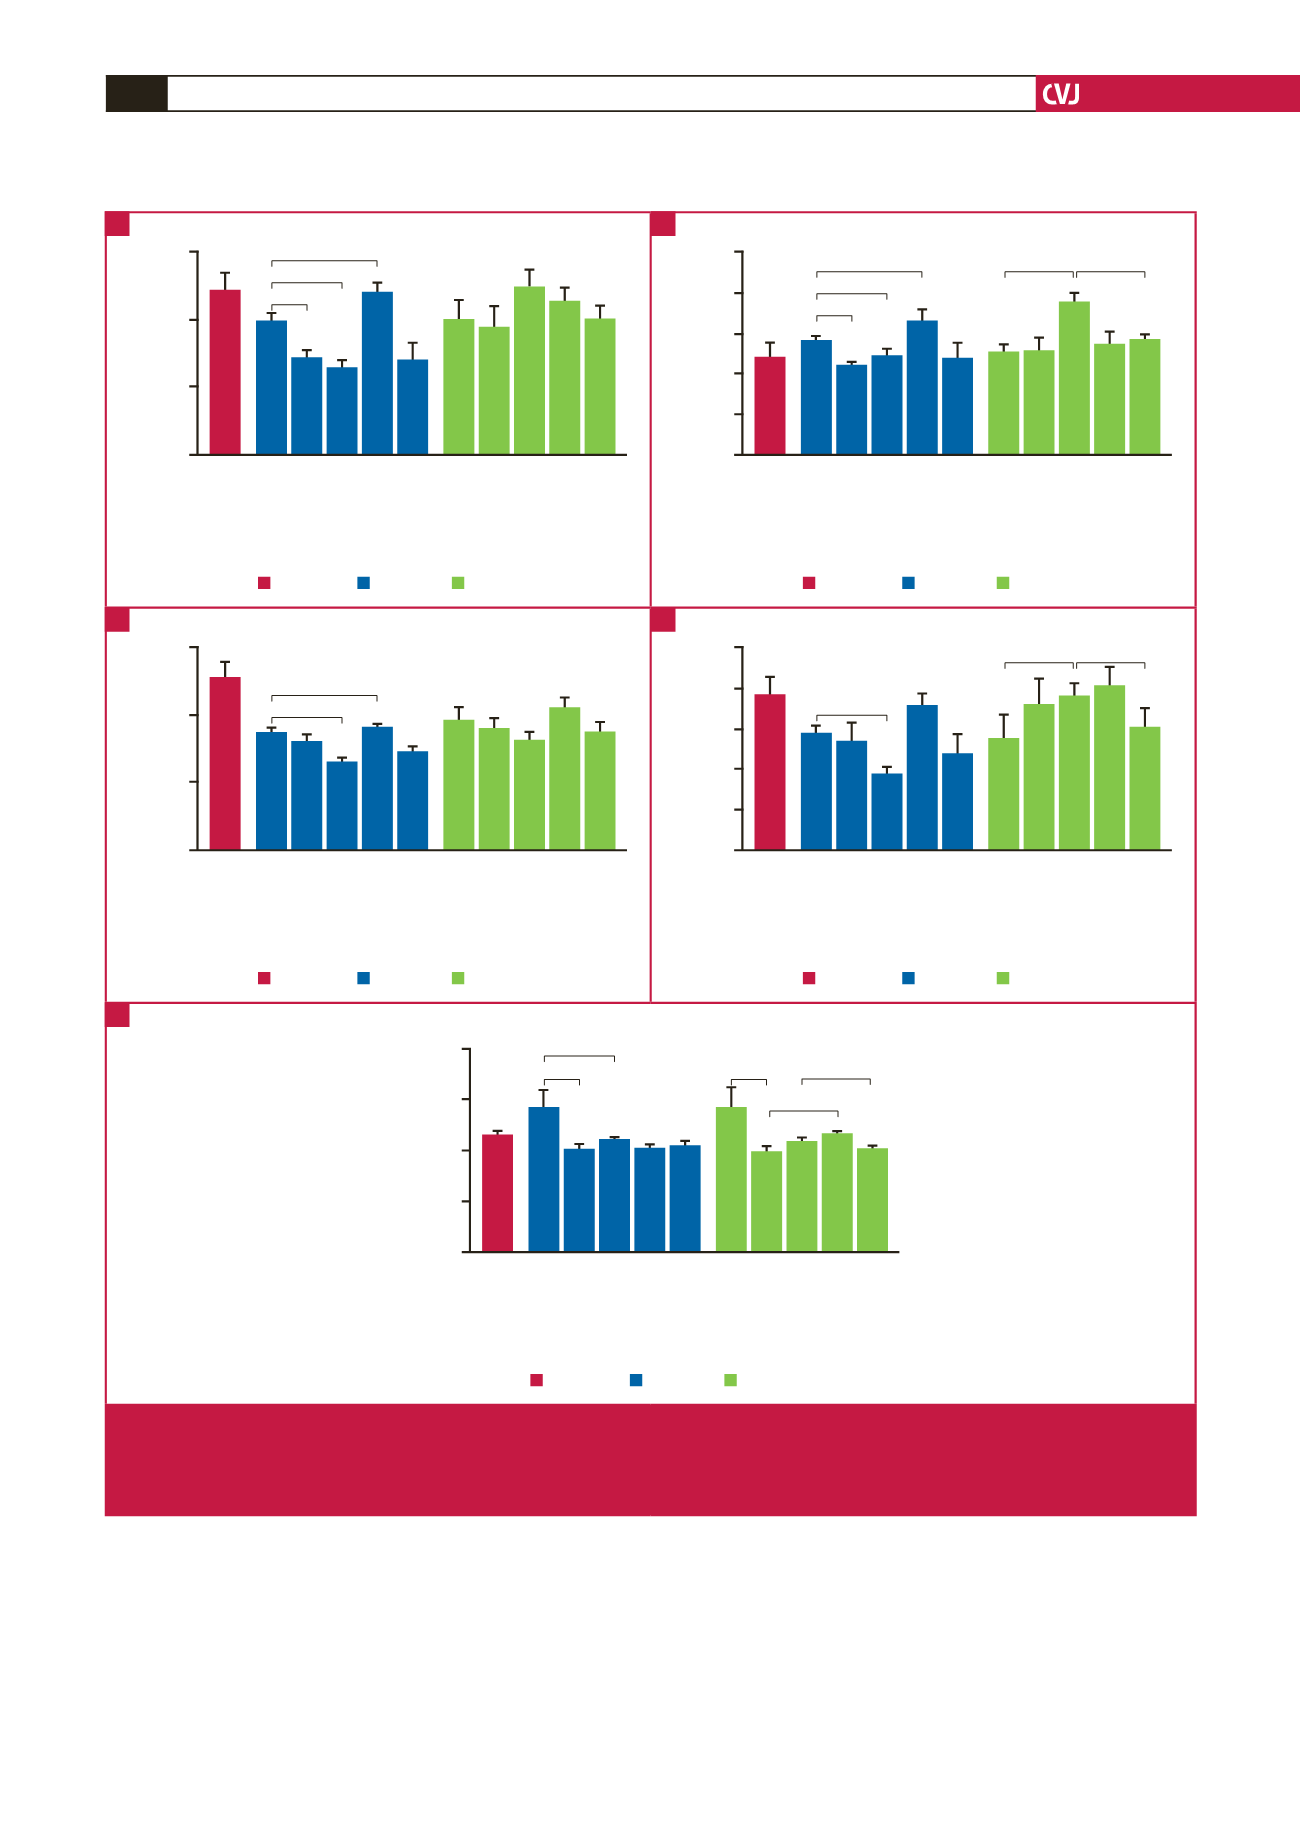
Fig. 4.
The effects of ischaemia/reperfusion and chloroquine treatment on mitochondrial function with palmitoyl-L-carnitine/malate
as substrates (
n
= five hearts /group). Measurements of mitochondrial function were made at the time points described in
Fig. 3. *
p
≤
0.05 vs corresponding untreated control rats. AMC: age-matched control; CON: control; CQ: chloroquine; STB:
stabilisation; ISC: ischaemia; RP: reperfusion; ox-phos: oxidative phosphorylation; RCI: respiratory control index.
A
C
E
B
D