


 15 / 66

CARDIOVASCULAR JOURNAL OF AFRICA • Volume 32, No 3, May/June 2021
AFRICA
125
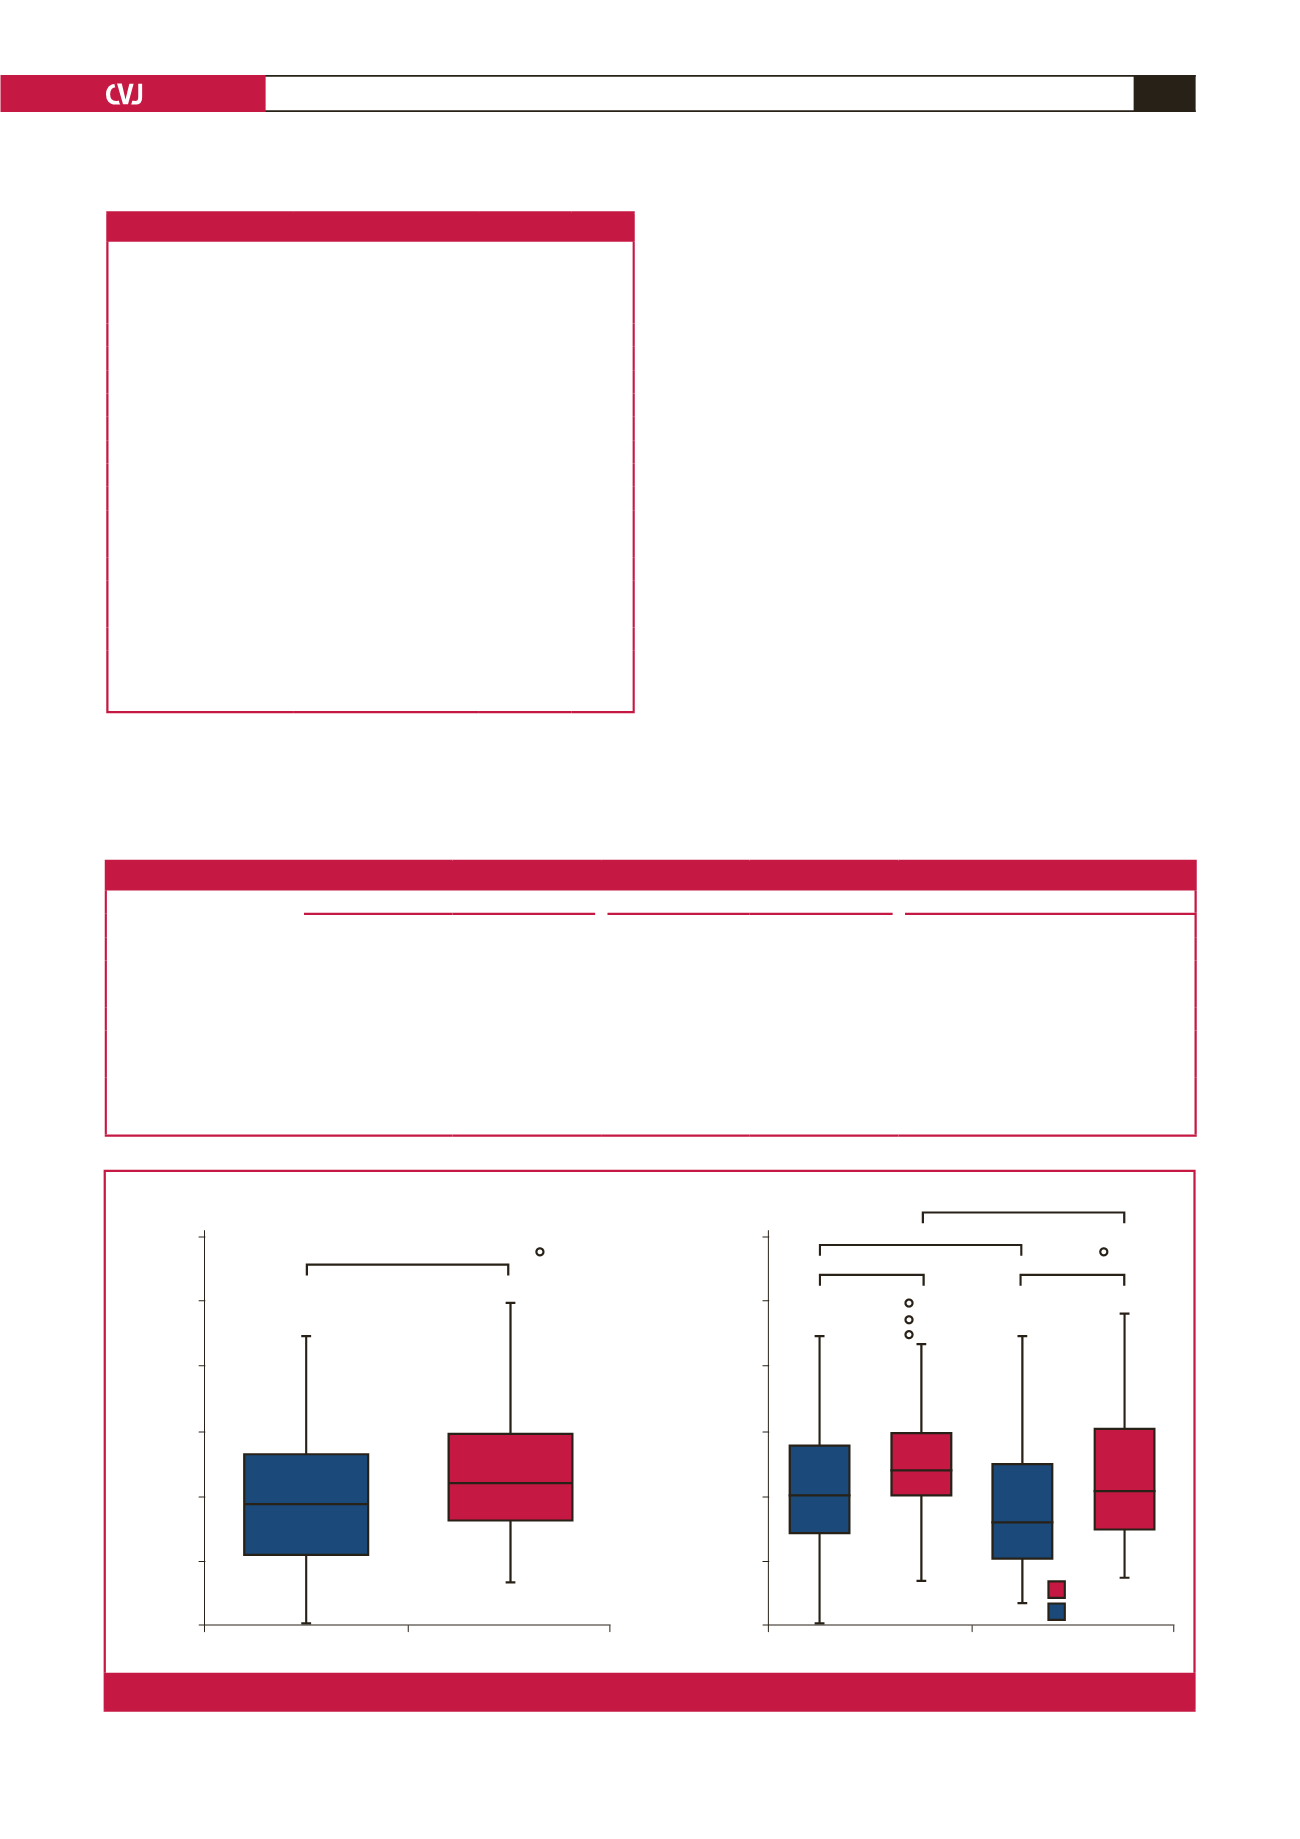
The FMD results at baseline and at six months after the
initiation of CR are presented in Table 2 and Fig. 1. At baseline,
the FMD values were lower in the patients with ACS than
in those with stable angina, but the mean difference was not
statistically significant (7.6 vs 8.2%, respectively,
p
= 0.180)
(Table 2) (Fig. 1). However, after six months of CR, the FMD
was significantly improved in both groups (1.3% increase in the
ACS group and 1.0% increase in the stable-angina group,
p
=
0.002). There were no significant differences in the FMD results
at the six-month follow up in the patients with ACS compared
to the patients with stable angina (9.2 vs 8.9%, respectively,
p
=
0.61).
The results for cardiopulmonary exercise testing and the
echocardiographic parameters are presented in Table 2. The results
for the VO
2max
, maximal metabolic equivalent (MMET), maximal
respiratory exchange ratio (max RER) and exercise duration were
similar in both groups. After the six-month CR programme, the
VO
2max
was improved in both groups (Table 2) (Fig. 2); the VO
2max
increased 2.1 ml/kg/min (0.8–3.4,
p
= 0.003) more in patients with
stable angina and 2.6 ml/kg/min (1.1–4.2,
p
< 0.001) more in ACS
patients at six months compared to the baseline value of each
group. The baseline left ventricular (LV) systolic function was
better in the stable-angina patients compared to the ACS patients
(59.4 ± 10.2 vs 43.6 ± 13.3%, respectively,
p
< 0.001). Additionally,
a greater improvement in LV systolic function occurred in the
ACS group compared to the stable-angina group, although the
difference was not statistically significant.
The results for the changes in biochemical parameters after
the end of the CR programme period are presented in Table 3.
Table 1. Baseline characteristics by clinical presentation
Variables
Total
(
n
= 119)
Stable
angina
(
n
= 50)
ACS
(
n
= 69)
p
-value
Age (years)
54. 9 ± 9.1 57.6 ± 8.5 52.9 ± 9.1 0.050
Male,
n
(%)
104 (87.4)
41 (82.0)
63 (91.3)
0.131
BMI (kg/m
2
)
24.9 ± 2.6 24.9 ± 2.5 24.9 ± 2.7 0.887
Hypertension,
n
(%)
38 (31.9)
19 (16.0)
19 (22.0)
0.227
Diabetes,
n
(%)
36 (30.3)
15 (30.0)
21 (30.4)
0.959
Dyslipidaemia,
n
(%)
39 (32.8)
16(32.0)
23 (33.3)
0.878
Current smoker,
n
(%)
55 (46.2)
18 (36.0)
37 (53.6)
0.057
Medication
ACEI/ARB,
n
(%)
71 (59.7)
23 (46.0)
48 (69.6)
0.010
β
-blockers,
n
(%)
85 (71.4)
29 (58.0)
56 (81.2)
0.006
Calcium antagonist,
n
(%)
21 (17.6)
16 (32.0)
5 (7.2)
< 0.001
Nitrate,
n
(%)
72 (60.5)
27 (54.0)
45 (65.2)
0.086
SBP (mmHg)
119.9 ± 12.1 121.8 ± 10.6 118.5 ± 12.9 0.145
DBP (mmHg)
70.3 ± 13.4 71.8 ± 12.4 69.2 ± 14.2 0.304
Heart rate (beat/min)
65.8 ± 8.9 63.9 ± 8.0 67.1 ± 9.4 0.069
Data are expressed as numbers (%) and means ± SD. ACS, acute coronary
syndrome; SBP, systolic blood pressure; DBP, diastolic blood pressure; ACEI,
angiotensin converting enzyme inhibitor; ARB, angiotensin II receptor blocker.
Baseline
After 6 months
FMD (%)
16.0
14.0
12.0
10.0
8.0
6.0
4.0
p
< 0.001
111
Stable angina
Acute coronary syndrome
FMD (%)
16.0
14.0
12.0
10.0
8.0
6.0
4.0
p
= 0.030
p
= 0.002
111
Baseline
After 6 months
66
25
119
p
= 0.180
p
= 0.610
Fig. 1.
Changes in FMD before and after a six-month CR programme. A. All patients. B. Patients with stable angina versus ACS.
Table 2. Changes in FMD, cardiopulmonary exercise testing and echocardiographic parameter results after a CR programme
Parameters
Total
Stable angina
ACS
Baseline
6 months
Baseline
6 months
Baseline
6 months
FMD (%)
7.9 ± 2.6
9.0 ± 2.3
**
8.2 ± 2.7
9.2 ± 2.1
*
7.6 ± 2.5
8.9 ± 2.4
*
Exercise duration (min)
15.3 ± 2.6
16.0 ± 2.7
15.0 ± 2.5
16.3 ± 2.1
**
15.4 ± 2.7
15.8 ± 3.0
MMET
8.3 ± 1.9
9.1 ± 2.2
**
8.2 ± 2.0
8.8 ± 1.9
*
8.5 ± 1.8
9.3 ± 2.4
**
Max RER
1.1 ± 0.1
1.2 ± 0.1
*
1.1 ± 0.1
1.2 ± 0.1
1.1 ± 0.1
1.2 ± 0.1
*
VO
2max
(ml/kg/min)
29.2 ± 6.6
31.9 ± 7.9
**
28.6 ± 6.9
30.9 ± 6.7
**
29.6 ± 6.4
32.5 ± 8.5
**
LVEF (%)
48.7 ± 21.1
49.7 ± 19.6
59.4 ± 10.2
59.9 ± 13.7
43.6 ± 13.3
‡
46.2 ± 16.3
‡
Data are expressed as numbers (%) and means ± SD. ACS, acute coronary syndrome; FMD, flow-mediated dilatation; LVEF, left ventricular ejection fraction; max
RER, maximal respiratory exchange ratio; MMET, maximal metabolic equivalent.
Baseline versus six months; *
p
< 0.05, **
p
< 0.01, stable angina versus ACS;
†
p
< 0.05,
‡
p
< 0.01.