


 16 / 66

CARDIOVASCULAR JOURNAL OF AFRICA • Volume 32, No 3, May/June 2021
126
AFRICA
The mean concentration of high-sensitivity C-reactive protein
(hs-CRP) at baseline was significantly higher in the ACS group
than in the stable-angina group (1.21 ± 3.73 vs 0.49 ± 1.46 mg/dl,
respectively,
p
= 0.023). However, six months after the initiation
of the CR programme, the mean hs-CRP concentration was
significantly decreased in both groups and was not significantly
different between groups (0.21 ± 0.39 vs 0.24 ± 0.49 mg/dl,
respectively,
p
= 0.989). The target goal for the mean low-density
lipoprotein (LDL) cholesterol concentration (88.0 ± 28.5 mg/dl;
2.28 ± 0.74 mmol/l) for the ACS group was not reached despite
efforts, such as high-intensity statin therapy, used to control it.
Discussion
In this study we showed that endothelial function, measured by
FMD, was improved in patients with coronary artery disease
who underwent PCI, regardless of ACS or stable angina after
a six-month CR programme. However, there was no significant
difference in the improvement of the FMD values between the
two groups. The ACS patients tended to have lower FMD values
before CR, compared to the patients with stable angina.
Endothelial function is an ‘excellent barometer’ of vascular
health and can be used to gauge cardiovascular risk.
9
A
pathogenic link between coronary endothelial dysfunction and
cardiovascular events was found almost simultaneously by
Suwaidi
et al
.
11
and Schächinger
et al
.
8
The FMD result reflects
the relaxation of a conduit artery when it is exposed to increased
flow and increased shear stress.
14
Numerous studies have documented the various effects
of cardiac rehabilitation on cardiovascular disease. In 2004,
Hambrecht
et al
. reported that when patients with stable coronary
artery disease participated in a 12-month programme of regular
physical exercise, they had superior event-free survival and
exercise capacity, and at lower cost, compared to patients treated
with PCI.
15
Many investigators have used FMD to evaluate the
post-CR improvement in endothelial function in patients with
coronary heart disease. Morikawa
et al
. suggested that exercise
training improves endothelial dysfunction in patients with
coronary spastic angina, and they found a significant correlation
between the reduction in attack frequency and the improvement
in FMD.
4
Recently, Ades
et al
. found that there was a dose–response
relationship between weight loss and endothelial-dependent
FMD in patients with serious coronary heart disease who
participated in a CR programme.
1
Weight loss and exercise
in overweight patients resulted in a significant improvement
in FMD. Their results suggested that the best predictor of
the improvement in FMD is weight loss per se, rather than
related measures, such as changes in fat mass, visceral fat, waist
circumference or insulin sensitivity.
1
The initial mean body mass
index (BMI) of their study population was 32.3 ± 4.1 kg/m
2
,
which was larger than that of our study population (24.9 ± 2.6
kg/m
2
). However, we found that there was an improvement in
FMD values after exercise training, even though most of the
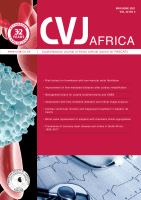
Baseline
After 6 months
VO
2max
(ml/kg/min)
60.0
50.0
40.0
30.0
20.0
10.0
p
< 0.001
94
Stable angina
Acute coronary syndrome
VO
2max
(ml/kg/min)
60.0
50.0
40.0
30.0
20.0
10.0
p
= 0.003
p
= 0.001
Baseline
After 6 months
p
= 0.422
p
= 0.385
Fig. 2.
Changes of VO
2max
before and after a six-month CR programme. A. All patients. B. Patients with stable angina versus ACS.
Table 3. Changes in biochemical parameters after a CR programme
Parameters
Total
Stable angina
ACS
Baseline
6 months
Baseline
6 months
Baseline
6 months
hs-CRP
0.87 ± 2.90
0.23 ± 0.44
*
0.49 ± 1.46
0.21 ± 0.39
*
1.21 ± 3.73
†
0.24 ± 0.49
*
HDL-C
42.4 ± 8.9
40.4 ± 8.0
*
44.7 ± 8.9
41.8 ± 8.3
*
40.7 ± 8.6
†
39.4 ± 7.8
*
LDL-C
116.9 ± 30.7
82.7 ± 24.7
**
115.3 ± 31.2
74.3 ± 13.8
**
118.2 ± 30.5
88.0 ± 28.5
**‡
HbA
1c
(%)
6.5 ± 1.5
6.5 ± 1.4
6.2 ± 1.1
5.7 ± 0.4
6.6 ± 1.7
6.8 ± 1.6
Data are expressed as numbers (%) and means ± SD. ACS, acute coronary syndrome; hs-CRP, high sensitivity C-reactive protein; HDL-C, high-density lipoprotein
cholesterol; LDL-C, low-density lipoprotein cholesterol.
Baseline versus six months; *
p
< 0.05, **
p
< 0.01, stable angina versus ACS;
†
p
< 0.05,
‡
p
< 0.01.