


 62 / 66

CARDIOVASCULAR JOURNAL OF AFRICA • Volume 32, No 3, May/June 2021
172
AFRICA
reference range 0–600 pg/ml; urine E: 66.74 μg/day, reference
range 0–20 μg/day; urine NE: 240.15 μg/day, reference range
0–90 μg/day; serum MN: > 20.56 nmol/l, reference range ≤ 0.5
nmol/l; serum NMN: > 20.56 nmol/l, reference range ≤ 0.9
nmol/l; urine VMN 46.7 mg/day, reference range ≤ 12 mg/day).
Repeat ECG showed elevated/depressed ST-segments
somewhat recovered, but retest of cardiac biomarkers showed a
TnI level of 12.4 ng/ml (reference range 0–1 ng/ml) and CK-MB
of 29.5 ng/ml (reference range 0–4.3 ng/ml). A transthoracic
echocardiogram (TTE) showed severely impaired LV systolic
function [ejection fraction (EF) 27%] with akinesis/hypokinesis
of the basal and middle LV segments and hyperkinesis of the
apical segments (Fig. 2A, B).
The patient soon developed heart failure and shock. He was
transferred to the intensive care unit (ICU) for life support,
utilising vasoactive drugs (noradrenaline), intra-aortic balloon
pump (IABP) and ventilator assistance. During treatment, the
TnI level, which peaked within 24 hours, began to drop from the
fourth day, and returned to normal in one week. CK-MB, which
peaked within 24 hours, began to drop from the third day, and
returned to normal on the 10th day.
During his hospitalisation, we paid close attention to the
change in cardiac function and checked his heart regularly with
TTE. TTE showed a distinct improvement in wall motion of the
LV basal and middle segments on the 12th day with an EF of
36%, so the IABP and ventilator were withdrawn on the 13th
and 14th days, respectively. On TTE, the wall motion of the LV
returned to almost normal after 17 days.
After discharge from hospital, the patient received adrenergic
alpha-receptor blockers. Three months later he had a repeat TTE
and the results were normal.
He thereafter underwent a left adrenalectomy. The pathology
examination revealed adrenal pheochromocytoma with
haemorrhage and rupture (Fig. 3A, B). After the patient was
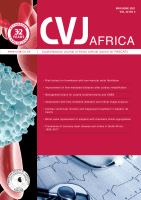
Fig. 1.
A. The first computed tomography (CT) on admission showed a 3.7-cm mass of uneven density in the left adrenal gland.
B. The second CT revealed the mass had expanded to 6.5 cm in diameter, with accumulation of fluid surrounding the left
pararenal and parapancreatic space.
A
B
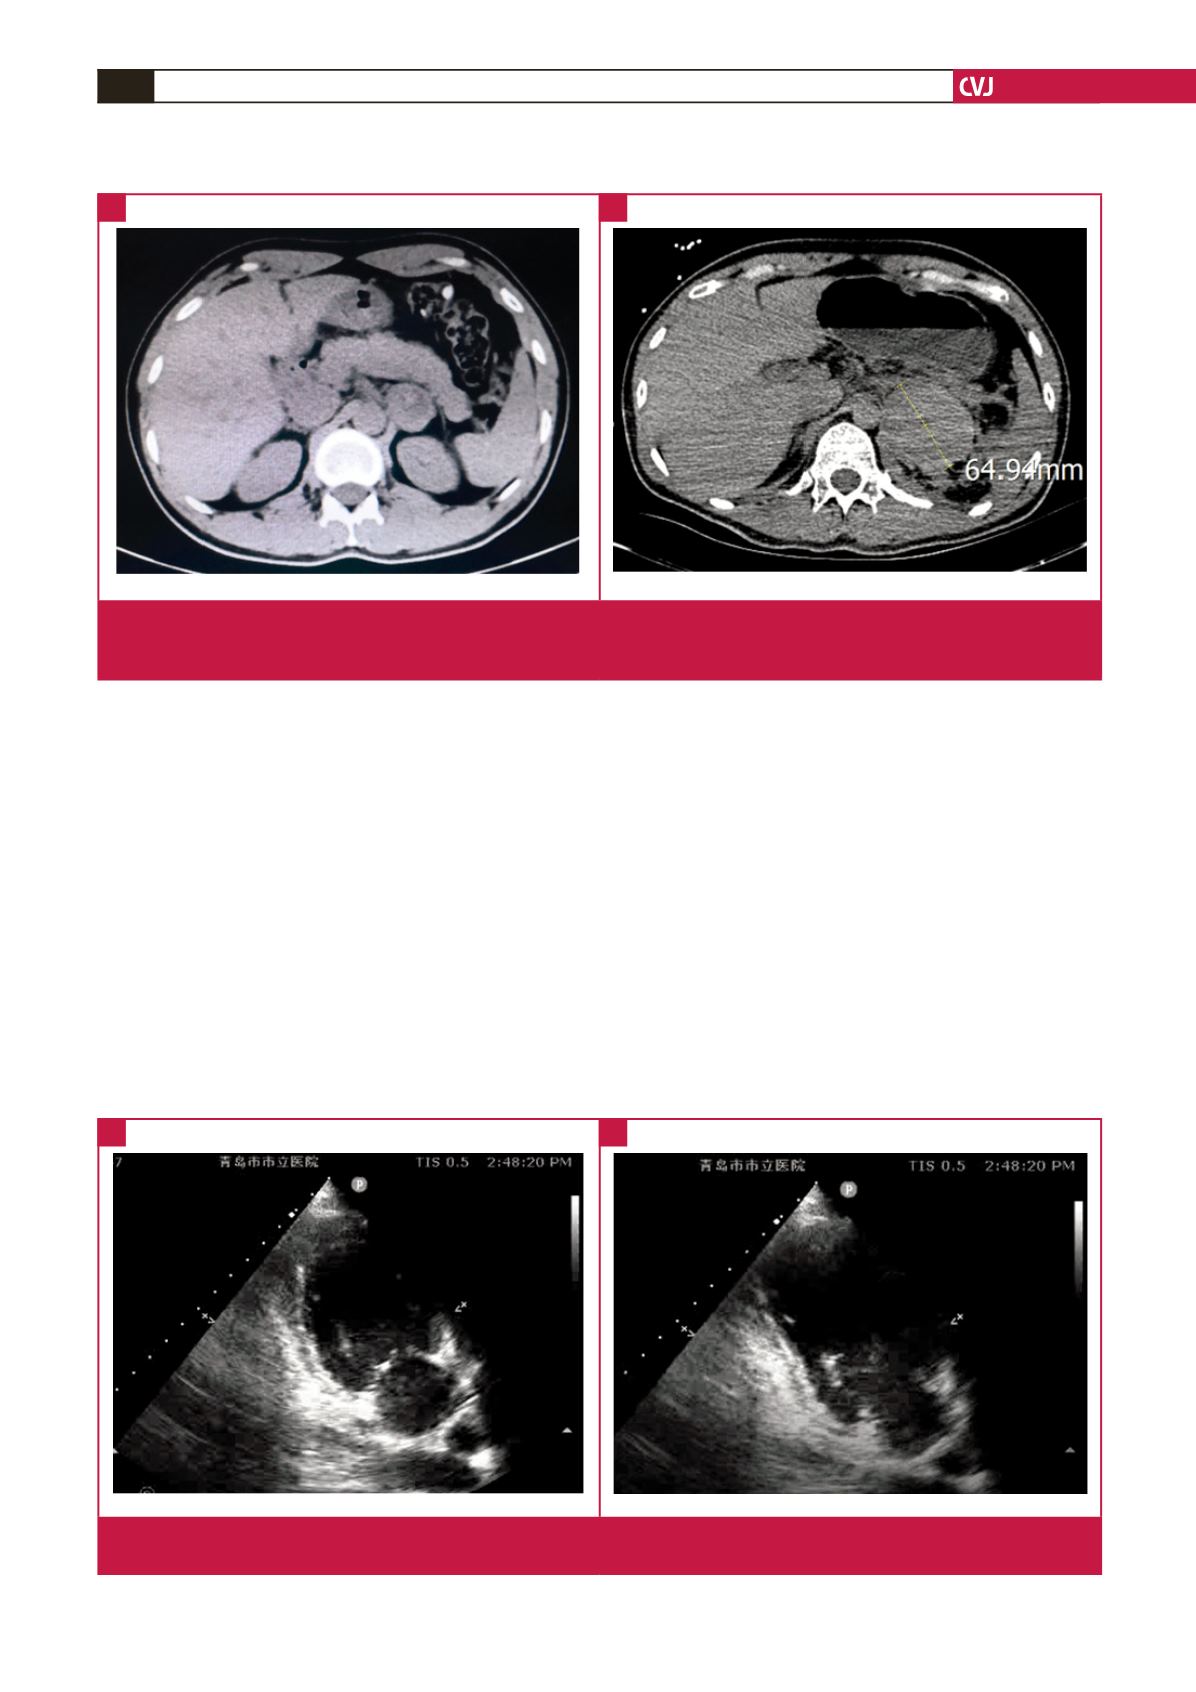
Fig. 2.
Transthoracic echocardiogram (TTE) showing severely impaired left ventricular systolic function with akinesis/hypokinesis of
the basal and middle left ventricular segments and hyperkinesis of the apical segments. A. Systolic phase. B. Diastolic phase.
A
B