


 8 / 66

CARDIOVASCULAR JOURNAL OF AFRICA • Volume 32, No 3, May/June 2021
118
AFRICA
Statistical analysis
We used SPSS 17.0 software for data analysis. Continuous
variables are expressed as mean (minimum and maximum)
values, and if they were normally distributed with homogeneity
of variance, the statistical analyses were performed using the
Student’s
t-
test. If they were not normally distributed, the
Wilcoxon rank-sum test was used. Count data are shown with
ratios, and were performed with the chi-squared test. Stepwise
multivariate logistic regression was used to screen for related risk
factors for LA/LAA thrombosis, to devise a new scoring system
denoted as the L
2
CHADS
2
score, and to calculate a receiver
operating characteristic (ROC) curve. This approach was used
to contrast this L
2
CHADS
2
value with that of the CHADS
2
and CHA
2
DS
2
-VASc scores in predicting LA/LAA thrombosis
through the AUC, sensitivity and specificity. A
p-
value < 0.05
was considered statistically significant.
Results
A total of 555 NVAF patients were recruited, of whom 35 were
classified into the thrombus group and 520 into the non-thrombus
group. Baseline demographics, clinical characteristics and
LAA measurements of patients with and without LA/LAA
thrombosis are shown in Table 1. There were no differences in
age and gender, CHADS
2
and CHA
2
DS
2
-VASc scores, windsock
LAA morphology, prevalence of hypertension, diabetes, stroke/
TIA and vascular disease, and lipoprotein(a) levels between the
thrombus and non-thrombus groups. There were significant
differences between the two groups in brain natriuretic peptide
(BNP), D-dimer and fibrinogen levels, eGFR, outside and inside
diameter of the LAA, LAA volume, LA diameter, chicken wing,
cactus and cauliflower LAA morphology, history of heart failure
and renal dysfunction.
Patients with cauliflower or cactus LAA morphology were more
likely to have thrombosis (
p
< 0.001 or < 0.01). In contrast,
patients with chicken wing LAA morphology were less likely
to have LA/LAA thrombosis (
p
< 0.001). Eighty and 28.1% of
the patients with non-chicken wing LAA were distributed in
the thrombus and non-thrombus groups, respectively, and the
difference was statistically significant (p < 0.001).
A regression model was built by adding all the covariates listed
in Table 1. The results of multivariate logistic regression analysis
(Table 2) showed that D-dimer (OR: 1.74; 95% CI: 1.073–2.807;
p
= 0.025), BNP (OR: 3.00; 95% CI: 1.709–9.677;
p
= 0.002),
LA diameter (OR: 4.07; 95% CI: 1.709–9.677;
p
= 0.002),
non-persistent AF (OR: 5.14; 95% CI: 1.911–13.818; p = 0.001)
and non-chicken wing LAA (OR: 11.48; 95% CI: 4.157–31.684;
p
= 0.000) were independent risk factors for LA/LAA thrombosis.
Table 1. Comparison of general data and related clinical
data between the thrombus and non-thrombus groups
Characteristic
Overall
Thrombus
group
Non-throm-
bus group c
2
/t/Z p-value
*
No of patients
555
35
520
Age, years (SD)
59.1 (19–85) 59.8 (34–78) 59.1 (19–85) 0.368 0.713
< 65,
n
(%)
375 (67.6)
24 (68.6)
351 (67.5)
0.017 0.896
65–74,
n
(%)
148 (26.7)
9 (25.7)
139 (26.7)
0.017 0.895
≥ 75,
n
(%)
32 (5.8)
2 (5.7)
30 (5.8)
0.000 0.989
Male/female,
n
(%)
211/344
(38/62)
13/22
(37.1/62.9)
198/322
(38.1/61.9)
0.012 0.912
Hypertension,
n
(%)
265 (47.7)
17 (48.6)
248 (47.7)
0.01 0.92
Diabetes,
n
(%)
66 (11.9)
6 (17.1)
60 (11.5)
0.983 0.321
Heart failure,
n
(%)
33 (5.9)
7 (20)
26 (5)
13.19 0.003
Stroke/TIA,
n
(%)
23 (4.1)
2 (5.7)
21 (4)
0.232 0.63
Vascular disease,
n
(%)
21 (3.8)
2 (5.7)
19 (3.7)
0.382 0.536
Renal dysfunction
(eGFR < 60 ml/min/
1.73 m
2
),
n
(%)
21 (3.8)
6 (17.1)
15 (2.9)
18.312 0.000
AF type (persistent
AF),
n
(%)
92 (16.6)
20 (57.1)
72 (13.8) 44.45 0.000
CHADS
2
score (SD)
0.81 (0–5)
1 (0–3)
0.8 (0–5) –1.24 0.215
CHADS
2
score ≥ 2,
n
(%)
92 (16.6)
8 (22.9)
84 (16.2)
1.07 0.302
CHA
2
DS
2
-VASc score
(SD)
1.52 (0–7)
1.77 (0–5) 1.51 (0–7) –1.16 0.25
CHA
2
DS
2
-VASc score
≥ 2,
n
(%)
248 (44.7)
17 (48.6)
231 (44.4)
0.288 0.633
Fibrinogen, g/l (SD)
3.00
(0.07–6.89)
3.47
(2.05–6.17)
2.97
(0.07–6.89)
–2.74 0.006
D-dimer, mg/ml (SD)
0.44
(0.07–6.89)
3.46
(2.05–6.17)
2.97
(0.07–6.89)
–3.02 0.003
eGFR, ml/min/1.73
m
2
(SD)
98.6
(5–125.2)
86.7
(17.8–125.2)
99.3
(5–125)
–3.62 0.000
Lipoprotein (a), mg/
dl (SD)
18.1 (1–96) 18.9 (3–75) 18.1 (1–96) –0.85 0.39
BNP, pg/ml (SD)
72.9 (4–1560) 235 (27–1560) 62 (4–1070) –6.86 0.000
LA diameter, mm
(SD)
3.11
(1.6–7.5)
4.19
(2.10–7.50)
3.04
(1.60–5.50)
–6.9 0.000
Outside diameter of
LAA, mm (SD)
1.67
(0.60–3.90)
1.88
(0.90–3.90)
1.66
(0.60–3.40)
–2.67 0.008
Inside diameter of
LAA, mm (SD)
1.94
(0.90–25.00)
2.12
(1.40–4.10)
1.96
(0.90–25.00)
–3.21 0.001
LAA volume, ml (SD)
6.73
(1.00–41.00)
9.49
(3.00–41.00)
6.55
(1.00–26.00)
–3.76 0.000
Chicken wing LAA,
n
(%)
377 (67.9)
7 (20)
370 (71.2) 39.3 0.000
Non-chicken wing LAA
Windsock LAA,
n
(%)
62 (11.2)
7 (20)
55 (10.6)
2.934 0.096
Cactus LAA,
n
(%) 104 (18.7)
13 (37.1)
91 (17.5)
8.309 0.007
Cauliflower LAA,
n
(%)
12 (2.2)
8 (14.3)
4 (0.8)
37.6 0.000
Values depicted for
n
are mean (minimum and maximum) or percent. TIA,
transient ischaemic attack; eGFR, estimated glomerular filtration rate; AF, atrial
fibrillation; BNP, brain natriuretic peptide; LA, left atrium; LAA, left atrial
appendage.
*
Comparison between thrombus and non-thrombus groups.
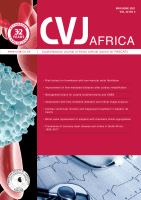
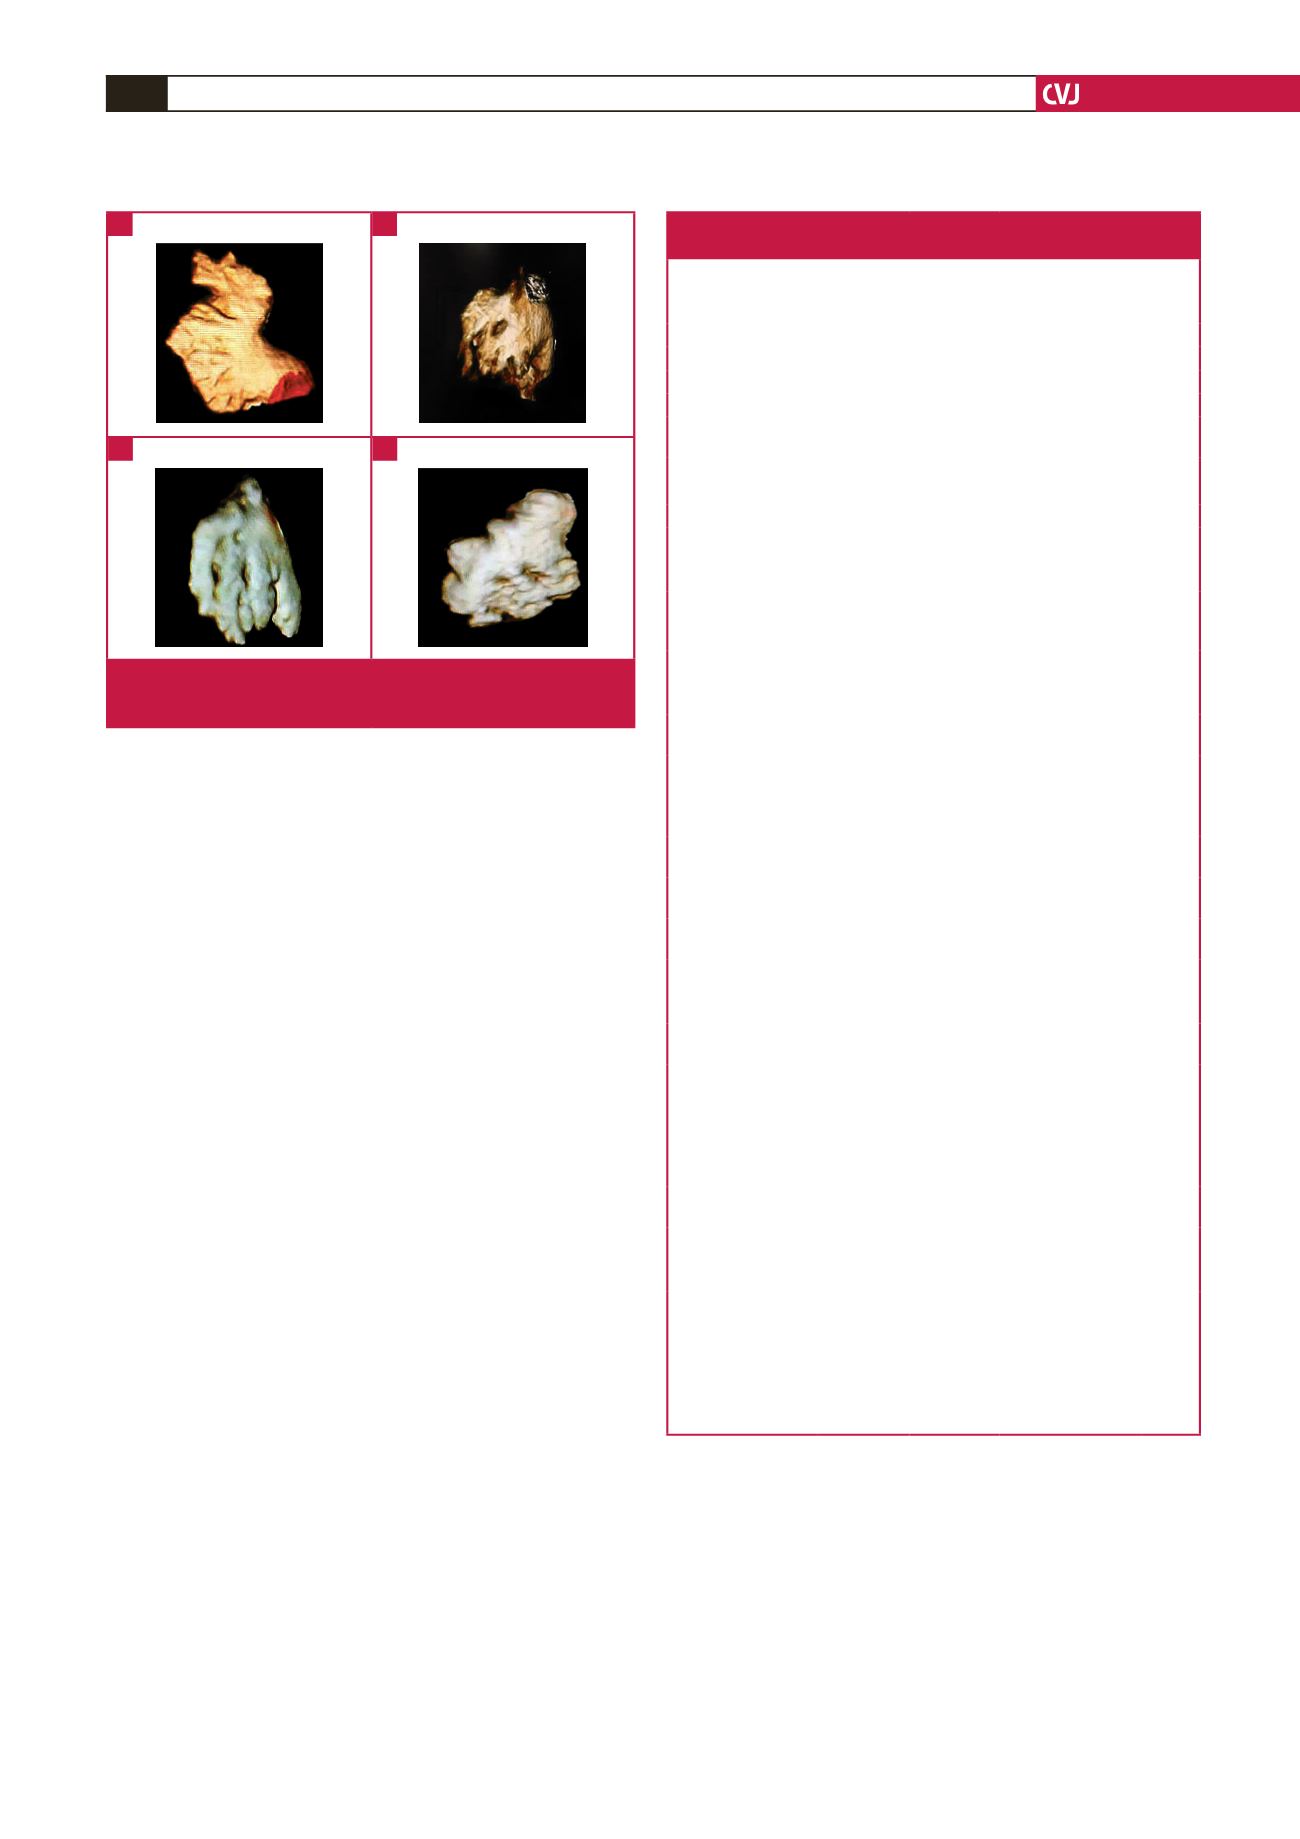
Fig. 2.
Four types of LAA morphology. A: chicken wing LAA,
B: cauliflower LAA, C: cactus LAA, D: windsock LAA.
A
C
B
D