


 9 / 66

CARDIOVASCULAR JOURNAL OF AFRICA • Volume 32, No 3, May/June 2021
AFRICA
119
In multivariable logistic regression analysis (Table 2),
non-chicken wing LAA was found to have the highest OR,
at 11.48. The CHADS
2
risk score is the most popular risk
stratification tool used,
19
so we further analysed the correlation
between LAA morphology and the CHADS
2
score.
Among the thrombus group in subjects with a CHADS
2
score
of zero or one point, the chicken wing LAA had the lowest
prevalence. The non-chicken wing LAA was significantly more
prevalent in the thrombus group compared with the chicken
wing morphology (85.2 vs 14.8%). In the non-thrombus group
with a CHADS
2
score of two points or more, the chicken
wing LAA had the highest prevalence, which was significantly
more prevalent in the non-thrombus group compared with the
non-chicken wing morphology (65.5 vs 34.5%). The prevalence
of cauliflower LAA was highest (66.7%), followed by cactus and
windsock LAA, with the chicken wing LAA the lowest (1.9%)
(Table 3).
We hypothesised that LAA morphology might be useful for
predicting LA/LAA thrombosis in NVAF patients, especially
when incorporating it with the CHADS
2
score. We therefore
endowed the non-chicken wing LAA morphology with two
points (the highest score) and derived the L
2
CHADS
2
score based
on the CHADS
2
score. The L
2
CHADS
2
score was composed
of a total of six risk factors, namely, congestive heart failure,
hypertension, diabetes, age ≥ 75 years, history of stroke or TIA
and chicken wing LAA. The chicken wing LAA and a previous
stroke/TIA would confer two points and the other four risk
factors could each add one point. Therefore the highest possible
score was eight points and the lowest was zero.
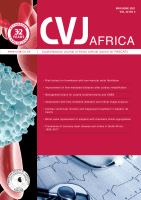
According to their CHADS
2
scores, 12 (34.3%) and 15 (42.9%)
subjects were classified as zero and one point, respectively,
namely low- and intermediate-risk categories (Fig. 3). The
corresponding classification with the CHA
2
DS
2
-VASc score was
four (11.4%) and 14 (40%) subjects. The two scoring systems
had a lower prevalence of subjects above two points, namely the
high-risk category. It was only with the L
2
CHADS
2
score that the
percentage of subjects classified in each category increased along
with the score and most of the subjects were distributed between
two points or more.
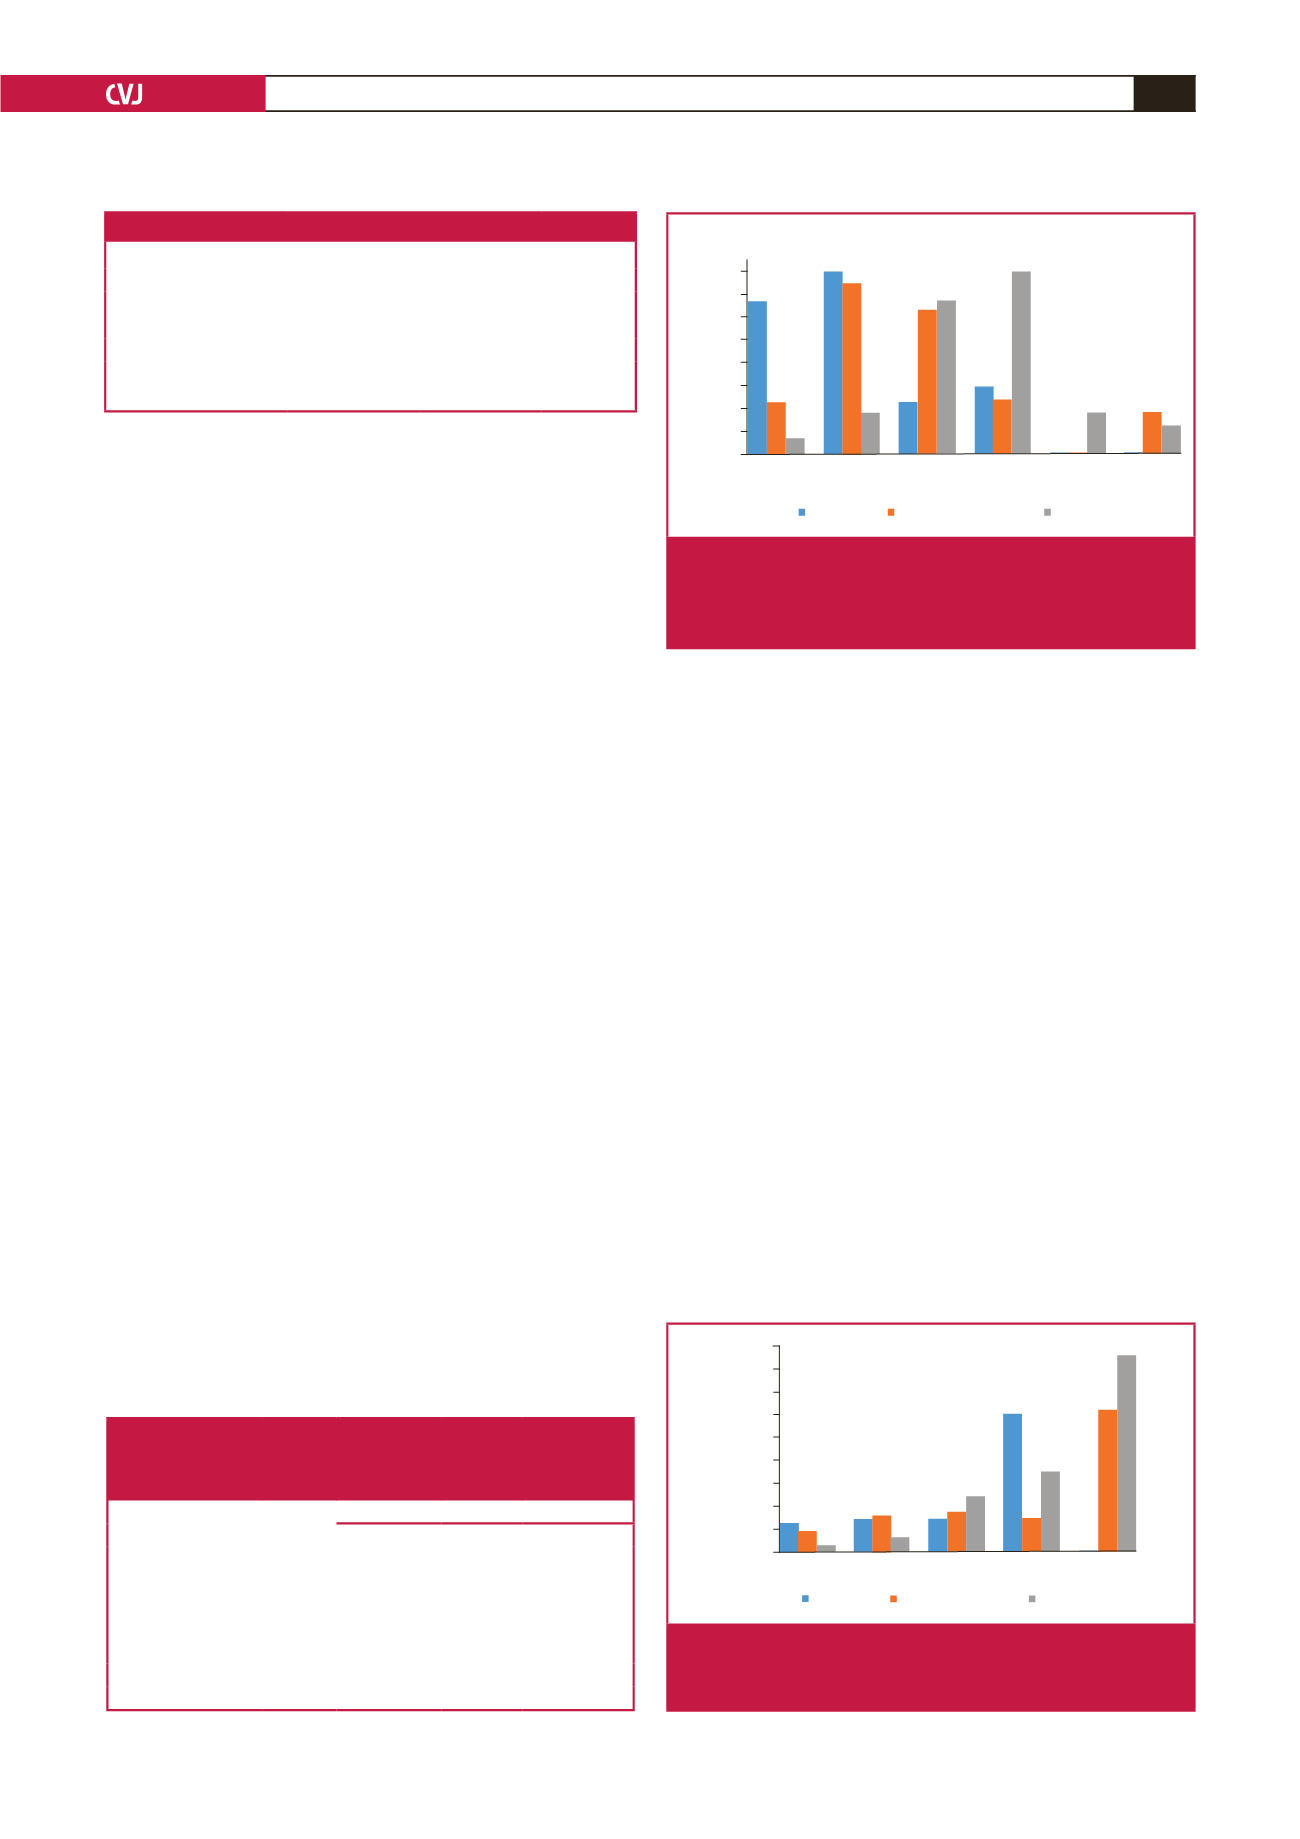
The incidence of thrombosis in the CHADS
2
and CHA
2
DS
2
-
VASc scores showed an increasing trend with the scores
increasing gradually (Fig. 4). The L
2
CHADS
2
score increased
more obviously and the thrombosis incidence was obviously
higher than that of the CHADS
2
and CHA
2
DS
2
-VASc scores in
the high-risk group.
Using a score ≥ one, one and two as cut-off points for the
CHADS
2
, CHA
2
DS
2
-VASc and L
2
CHADS
2
scores, respectively,
their sensitivity and specificity were 0.657 and 0.427, 0.886 and
0.225, and 0.886 and 0.225, respectively; the AUC was 0.558,
0.557 and 0.767, respectively. The AUC of the L
2
CHADS
2
score
in predicting LA/LAA thrombosis was obviously higher than
that of the CHADS
2
and CHA
2
DS
2
-VASc scores, which had
similar predictive power.
These results confirmed that the L
2
CHADS
2
score was
superior to the CHADS
2
and CHA
2
DS
2
-VASC scores for
prediction of the development of LA/LAA thrombi. The
positive and negative predictive values of the L
2
CHADS
2
score
(13.1 and 98.7%) were higher than those of the CHADS
2
(8.7
and 94.2%) or CHA
2
DS2-VASc scores (6.9 and 6.9%) (Fig. 5).
Table 3. LAA morphology and risk of LA/LAA thrombus in the thrombus
group with a CHADS
2
score of zero or one point, in the non-thrombus
group with a CHADS
2
score of two points or more, and thrombosis ratio
of chicken wing and non-chicken wing LAA morphology
Variable
Chicken
wing (%)
Non-chicken wing (%)
Windsock (%) Cactus (%) Cauliflower (%)
Thrombus group
(CHADS
2
score 0 or
1 point)
14.8
85.2
Non-thrombus group
(CHADS
2
score 2
points or more)
65.5
34.5
Thrombosis ratio
1.9
11.4
12.5
66.7
15.7
40
35
30
25
20
15
10
5
0
34.3
0
11.4
2.9
1
40
37.1
8.6
2
11.4
31.4
34.3
3
14.3
11.4
40
4
0 0
8.6
5
0
8.6
5.7
Score
The proportion of different scores
in thrombus group (%)
CHA
2
DS
2
CHA
2
DS
2
-VASc
L
2
CHADS
2
Fig. 3.
Prevalence (percentage) of patients classified in each
score according to the CHADS
2
, CHA
2
DS
2
-VASc and
L
2
CHADS
2
risk-stratification schemes in the thrombus
group.
40
45
35
30
25
20
15
10
5
0
5.1
3.3
0.06
0
6.1 7
1.9
1
6.1 7.6
11
2
29.4
6
16.6
3
30
42.1
0
4-7
Score
Incidence of thromosis (%)
CHA
2
DS
2
CHA
2
DS
2
-VASc L
2
CHADS
2
Fig. 4.
Prevalence (percentage) of LA/LAA thrombosis in
each score according to the CHADS
2
, CHA
2
DS
2
-VASc
and L
2
CHADS
2
risk-stratification schemes.
Table 2. Multivariate OR for LA/LAA thrombosis
Variable
Hazard ratio
95% CI
p
-value
D-dimer
1.735
1.073–2.807
0.025
BNP (pg/ml)
3.002
1.683–5.355
0.000
LA diameter
4.066
1.709–9.677
0.002
Non-persistent AF
5.139
1.911–13.818
0.001
Non-chicken wing LAA
11.476
4.157–31.684
0.000
BNP, brain natriuretic peptide; LA, left atrium; LAA, left atrial appendage.