CARDIOVASCULAR JOURNAL OF AFRICA • Vol 24, No 4, May 2013
142
AFRICA
number of adult patients who require treatment for late-onset
aortic stenosis or regurgitation. Any consideration of the burden
of congenital heart disease must take these into account. Table 1
shows some of these figures.
As far as we can tell, the incidence of congenital heart disease
is similar in all countries. There are some minor differences in
types of congenital heart disease by country. For example, China
and Japan have a higher incidence of subpulmonic ventricular
septal defects, whereas coarctation of the aorta and aortic stenosis
may be slightly less common in Asian countries. These variations
do not appear to cause major differences in total incidence of
congenital heart disease. Therefore, because we have good data
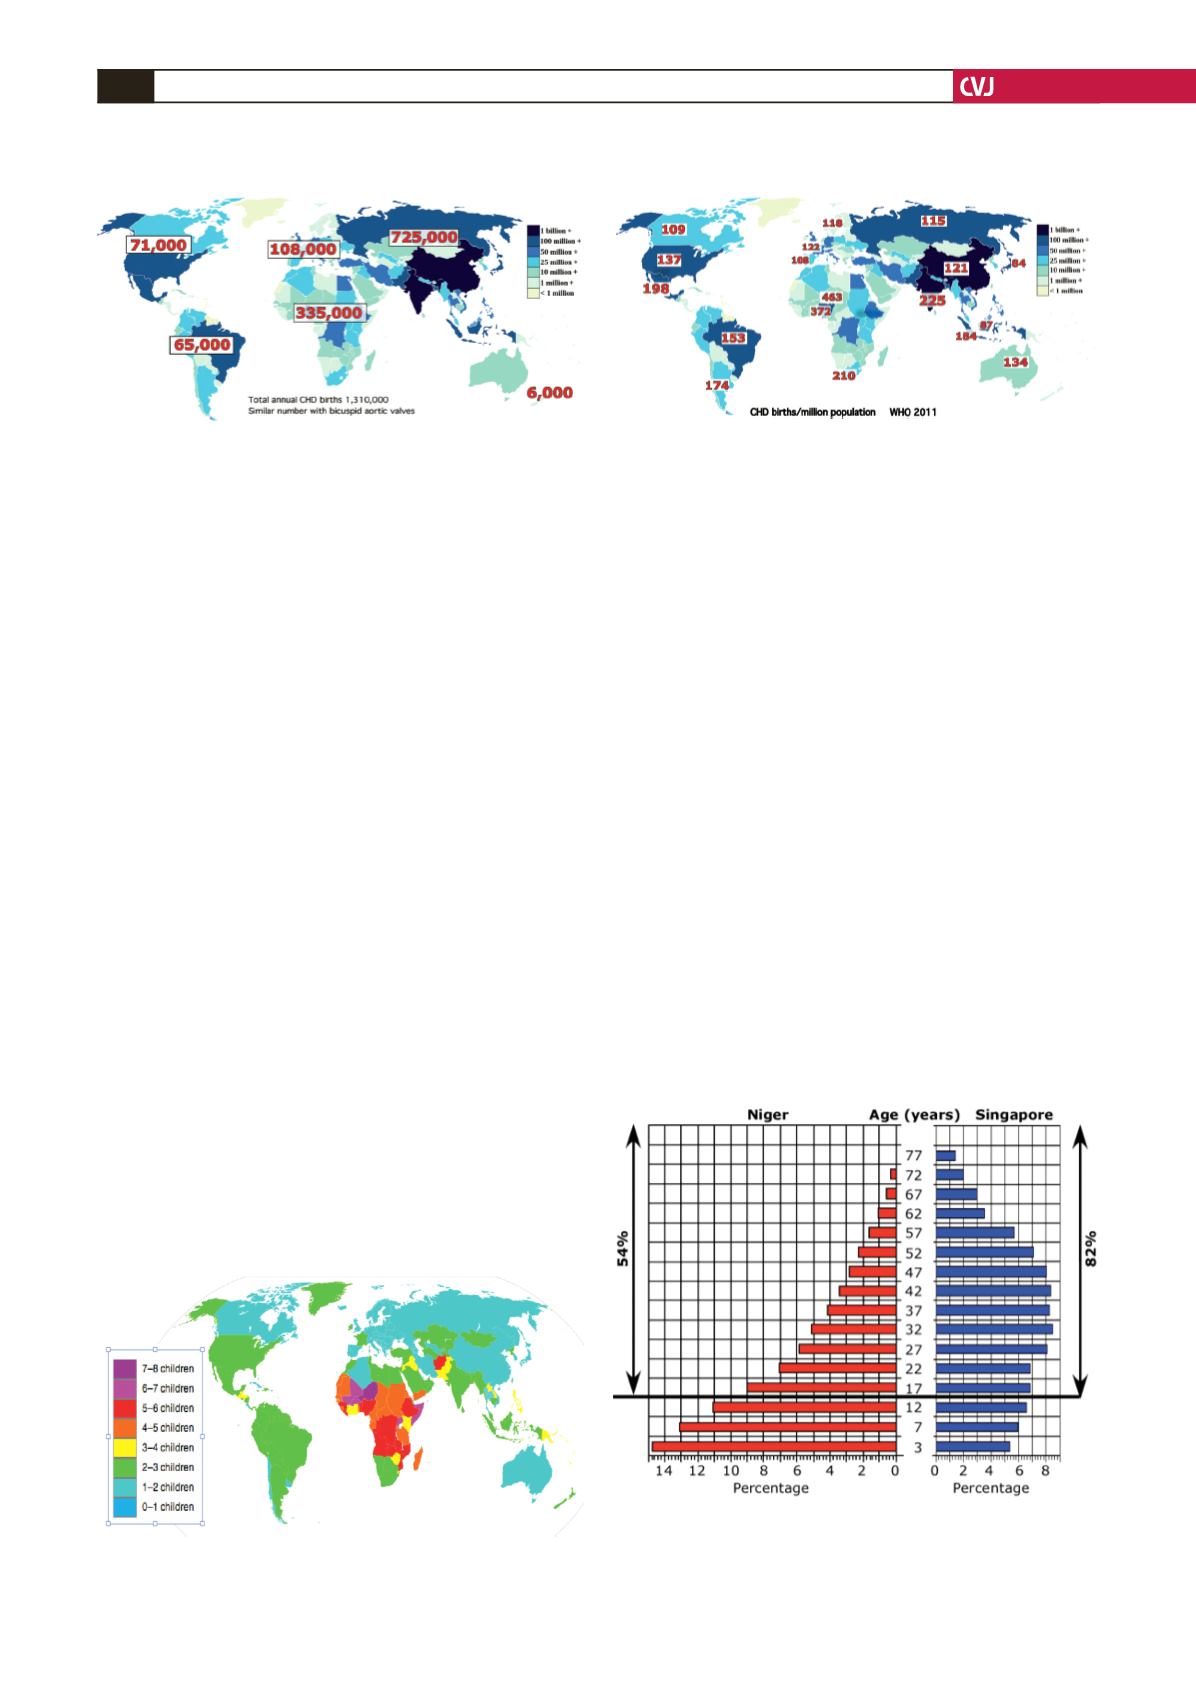
on the annual number of births in different countries (Fig. 1), we
can estimate how many children are born with congenital heart
disease in different countries and continents (Fig. 2)
The important datum is not howmany children with congenital
heart disease are born per country but howmany of these children
are born per million population, because this ratio tells us more
about the burden of congenital heart disease. We can derive this
information by knowing the fertility rate (the number of children
born per woman) in different countries (Fig. 3). These data were
taken from Wikipedia, based on data from the United Nations
and the CIA World Factbook, accessed at
.
org/wiki/List_of_sovereign_states_and_dependent_territories_
by_fertility_rate.
Because countries with higher fertility rates have more births
per unit of population, they have a disproportionate number of
children born with congenital heart disease (Fig. 4) and this
imposes an added burden. This disproportionate burden on
countries with high fertility rates is made even worse by the age
structure of the population. As shown in Fig. 5, countries with
high fertility rates have a higher proportion of younger people.
Because the burden of supporting children with congenital
heart disease falls on those who are wage earners, it is reasonable
to examine numbers of children with congenital heart disease per
million wage earners. Therefore the 463 children with congenital
heart disease per million population in Niger, where only 54%
of the people are over 15 years of age, would be 463/0.54
=
857 per million wage earners. In Singapore, where 82% of the
population is over 15 years of age, the ratio of children with
congenital heart disease per million population is about 120.
Not only does this disproportion in population ages increase the
burden on countries with a high fertility rate, almost all of which
are in sub-Saharan Africa, but the higher proportion of women of
child-bearing age exacerbates their problems by leading to more
future births of children with congenital heart disease.
In addition to having a higher proportion of children with
congenital heart disease per wage earner, countries with high
fertility rates tend to be those with lower per capita income.
Therefore if we contrast two extremes of Niger and Singapore,
we get the inequality shown in Table 2. This disparity is
reduced somewhat by lower local costs in poorer countries.
Costs such as labour to run hospitals, items constructed locally,
food for patients, and fees paid to surgeons and anaesthetists,
for example, are almost certainly much less in Niger than in
Singapore. Other costs for imported goods, such as machines
Fig. 3. Fertility rates by country. Published with permis-
sion from the World Health Organisation.
Fig. 4. Number of children born with congenital heart
disease per million population.
Fig. 2. Total annual births of children with congenital
heart disease by continent, based on Table 1 and data on
total births. The panel at the side indicates the population
ranges of the different countries.
Fig. 5. Age distribution in Singapore with a low fertility
rate, and Niger with a high fertility rate. Based on data
from the Department of Statistics, Singapore, and US
Census Bureau International data base.


