CARDIOVASCULAR JOURNAL OF AFRICA • Vol 24, No 5, June 2013
176
AFRICA
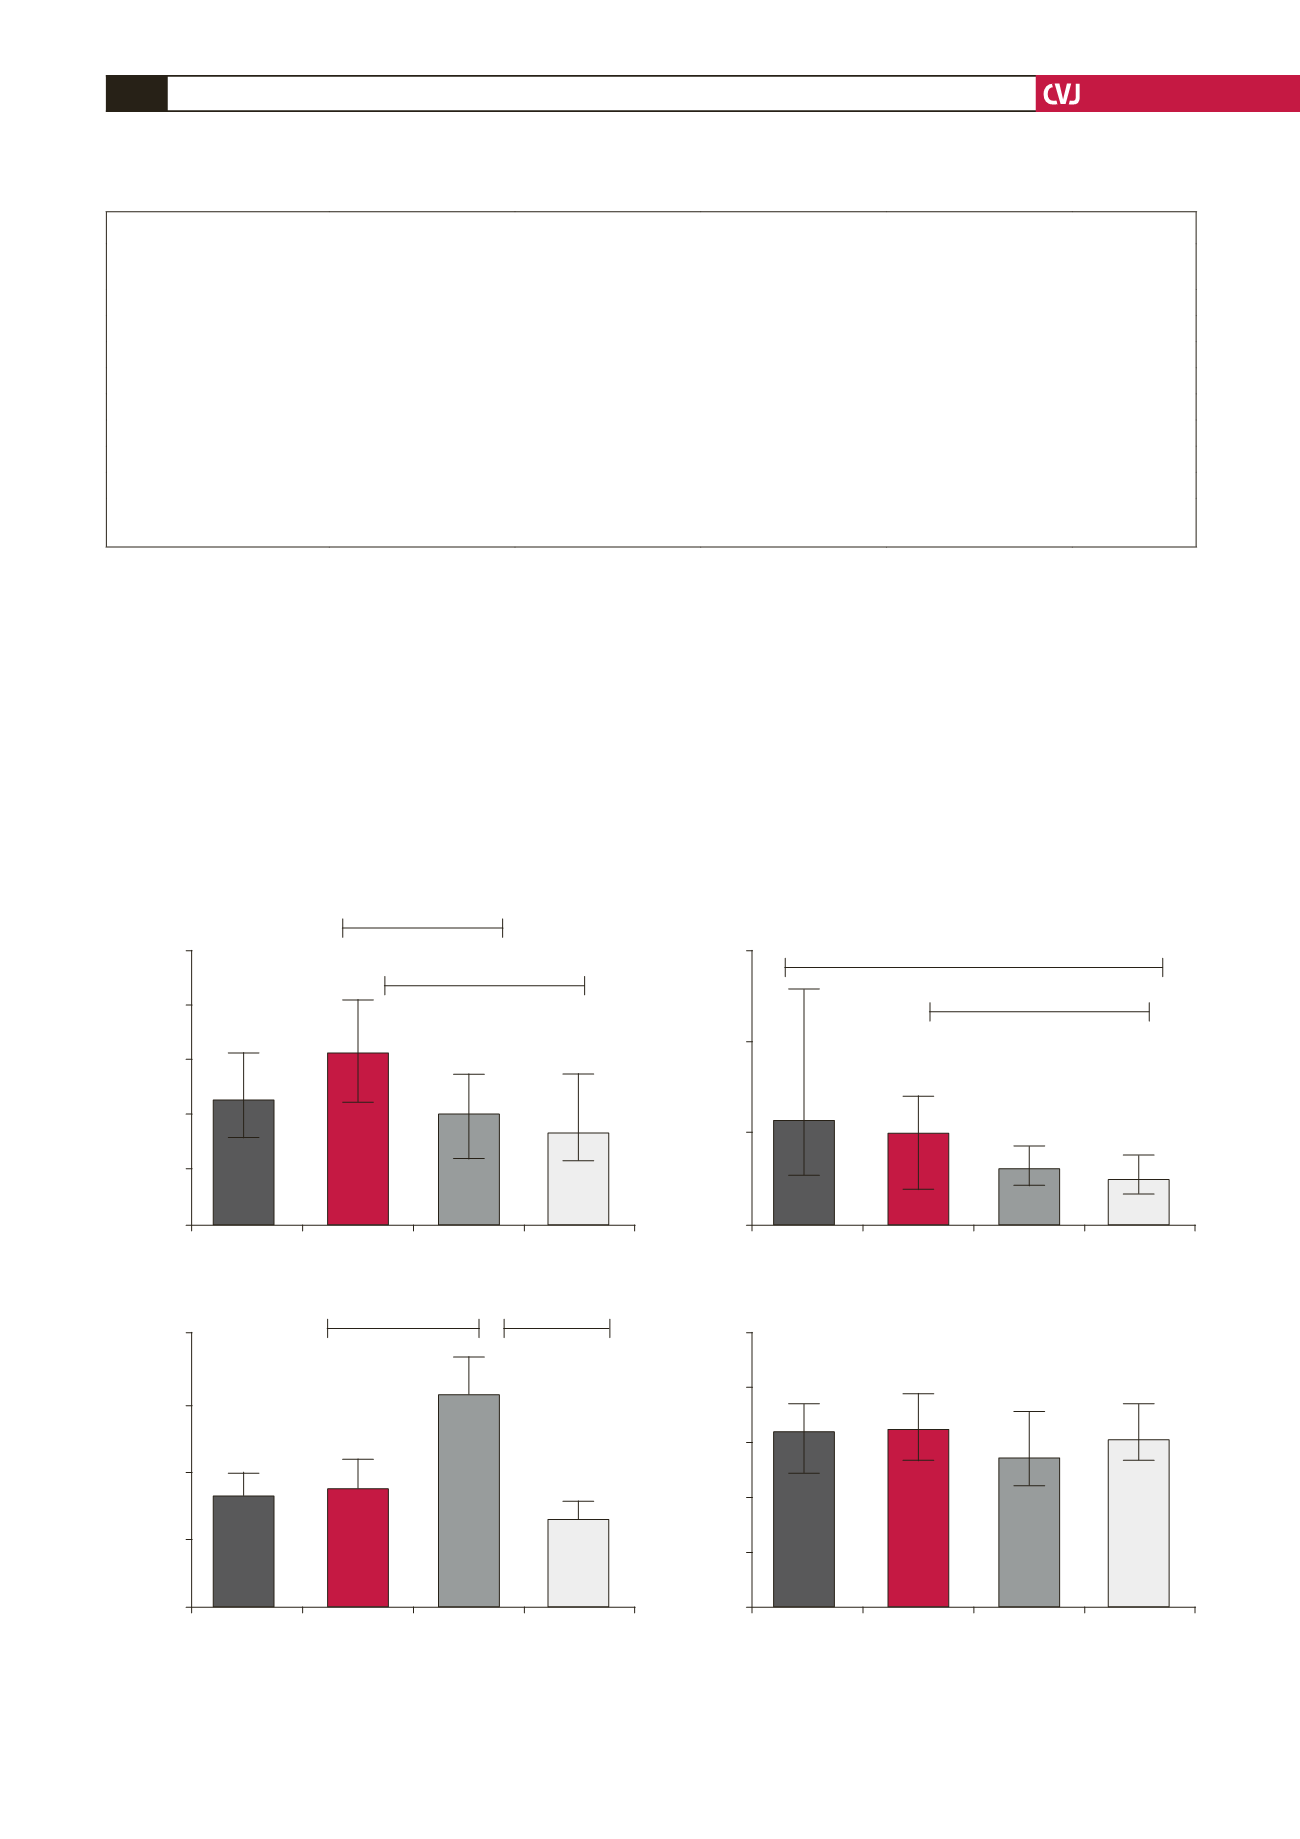
normotensive and HIV-positive normotensive pregnant women
(
p
=
0.021). However, TGF-
β
1
did not differ significantly
between groups (
p
=
0.359; Fig. 1).
Anti-angiogenic ratio analyses revealed a significant
difference only for sEng/TGF-
β
1
ratios (
p
<
0.05, Table 2, Fig.
2a). Accordingly, the Dunn’s multiple comparison test revealed
a significant difference for both HIV-positive pre-eclamptic
and HIV-positive normotensive pregnant women (
p
=
0.002),
and HIV-negative pre-eclamptic and HIV-positive normotensive
pregnant women (
p
=
0.002).
Discussion
Since placental delivery is the only cure for pre-eclampsia, its
clinical management is dependent on gestational age and disease
severity. In our study, gestational age and placental weight varied
among the study groups. The pre-eclamptic groups (HIV positive
and negative) delivered at a slightly earlier gestational period
compared with the normotensive groups.
Our data revealed that placental weights for the pre-eclamptic
groups were greater than the normotensive groups. This is
surprising as one would have expected the placental weights
Fig.1. Pro-angiogenic and anti-angiogenic serum concentrations (medians with interquartile range). (A) sFlt1 (pg/
ml), (B) sEng (ng/ml), (C) PlGF (pg/ml) and (D) TGF beta 1 (pg/ml); HIV-positive pre-eclamptic (P
+
); HIV-negative pre-
eclamptic (P–); HIV-negative normotensive (N–) and HIV-positive normotensive (N
+
).
A
C
B
D
25000
20000
15000
10000
5000
0
800
600
400
200
0
60
40
20
0
50000
40000
30000
20000
10000
0
P+
P–
N–
N+
P+
P–
N–
N+
P+
P–
N–
N+
P+
P–
N–
N+
sFlt-1 (pg/ml)
PIGF (pg/ml)
sEndoglin (ng/ml)
TGF beta 1 (pg/ml)
*
*
*
*
*
*
TABLE 2. COMPARISON OF PRO-ANGIOGENICANDANTI-ANGIOGENIC FACTORS OF MATERNAL SERUMACROSS STUDY GROUPS
Normotensive
pregnant women (N–)
HIV normotensive
pregnant women (N+)
Pre-eclamptic
pregnant women (P–)
HIV pre-eclamptic
pregnant women (P+)
p-value
Number
27
31
27
25
sFlt-1(pg/ml)
10249 (6308–13708)
8578 (5898–13769)
15617 (11257–20641)
11494 (8203–15784)
0.006*
sEng (ng/ml)
13.14 (9.6–17.92)
10.4 (7.3–16)
20.5 (8.5–29)
23 (11.8–52.5)
0.002*
PlGF (pg/ml)
488.6 (183.9–848.3)
207.1 (102.6–358.6)
202.2 (47.9–490.4)
229.3 (74.3–615.9)
0.021*
TGF-
β
1 (pg/ml)
27640 (22308–35771)
31164 (26916–37474)
32652 (27295–39328)
32301 (24983–37355)
ns
sEng/TGF-
β
1 (pg/ml)
0.48 (0.33–0.6)
0.32 (0.2–0.45)
0.62 (0.38–0.95)
0.59 (0.38–1.5)
0.002*
sFlt-1/PlGF (pg/ml)
21.4 (7.2–50.8)
41.6 (14.5–140.7)
66.5 (28.3–136.9)
37.3 (14.8–106.2)
ns
sFlt1+sEng/ PlGF (pg/ml)
12392 (8792–15700)
9422 (7014–16914)
12988 (6859–17276)
10772 (8345–13527)
ns
Medians (range) are presented; Kruskal-Wallis test and the
post hoc
Dunns multiple comparison test was used for statistical analysis,
n
=
110. *
p
<
0.05;
non-significant (ns).


