


 41 / 92

CARDIOVASCULAR JOURNAL OF AFRICA • Volume 27, No 4, July/August 2016
AFRICA
243
Serum study
Complements (C3c, C4), immunoglobulins (IgG, IgM) and
proteins were analysed from blood samples. A total of 5 ml of
venous blood was drawn from each patient and these samples
were rapidly transferred to acid–citrate–dextrose Adenin (ACD
A) tubes (Becton Dickinson, Meylan, Cedex, France).
Monoclonal antibodies (20
µ
l) of IgG
1
FITC/IgG
1
PE/ PerCP
were added to each tube containing 1
×
10
6
cells. Erythrocytes
were separated and removed with the addition of 2–3 ml
of lysing solution (Becton Dickinson, San Jose, USA) after
incubation in the dark at room temperature for 20 minutes.
Subsequent to the lysing solution, the samples were irrigated
with 2 ml of phosphate-buffered saline (PBS) and suspended in
500
µ
l PBS containing 1% paraformaldehyde.
The samples were maintained at 2–8°C in the dark until
analysis. Humoral analysis was done using the FACSCanto
flow cytometry system and BD FACSDiva program (Becton
Dickinson, Immunocytometry Systems, San Jose, CA 95131
USA).
Electron microscopy
Samples were gathered from the oxygenators with a sterile
scalpel after opening the hard, protective cover surrounding
the oxygenator with a Dremel cutting burr (Widget Supply
Inc, Albany, Oregon, USA). The samples were obtained in two
different sizes, containing 300 fibres (6 cm) and 50 fibres (1 cm).
Ultrasonic washing was performed on the 6-cm samples for
mechanical cleaning. The fibres were maintained in 50-ml tubes
containing 35 ml isotonic saline. Liquid nitrogen was added to
the fibres prior to transection and electron microscopy. Electron
microscopy was performed with the FEI Quanta 200 FEG scanning
electron microscope (SEM) (FEI Europe, Nanoport, Eindhoven,
The Netherlands) under an acceleration voltage of 22 kV.
2
Fixation of the 1-cm fibres with 2.5% glutaraldehyde solution
for 24 hours was followed by irrigation with Sorensen’s phosphate
buffer (SPB). The next fixation was done with 1% osmium
tetroxide, and the fibres were irrigated again with SPB solution.
Increasing concentrations (25, 50, 75 and 100%) of acetone were
used for dehydration.
The samples were transferred to Petri dishes and dried for six
hours. After drying, the material was adhered to metallic plates
of the SEM and coated with a mixture gold and palladium of
100-Å thickness using a Bio-Rad sputter apparatus (Bio-Rad
Laboratories headquarters, Hercules, CA, USA). After keeping
the samples in a dry medium for 24 hours, electron microscopy
was performed with a Jeol SEM ASID-10 device (Jeol Ltd,
Tokyo, Japan) under 80-kV acceleration voltage.
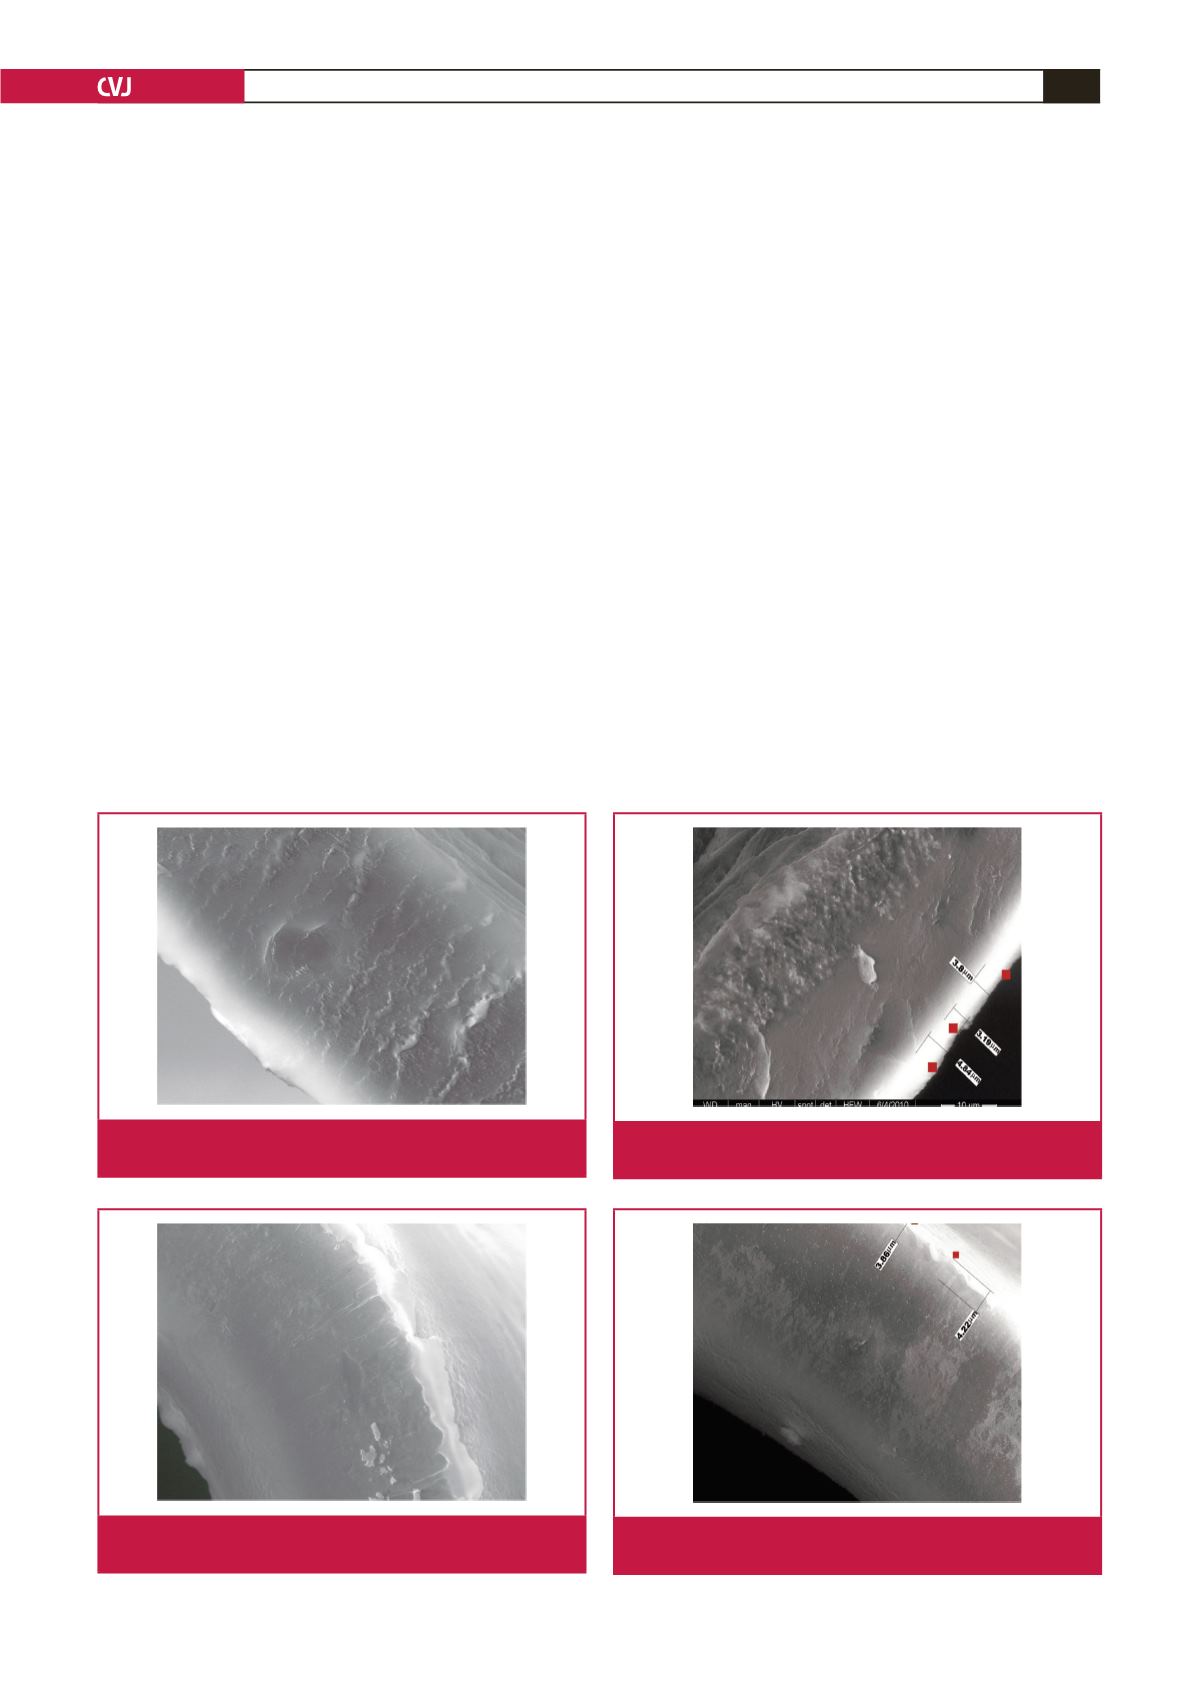
Electron microscopic views of the coated and uncoated
oxygenator fibres are shown in Figs 1 and 2. Adsorption of
proteins on the fibres of the coated and uncoated oxygenator
fibres can be seen in Figs 3 and 4.
Fig. 1.
Electron microscopic view of a phosphorylcholine-
coated oxygenator fibre.
Fig. 2.
Electron microscopic view of an uncoated oxygenator
fibre.
Fig. 3.
Protein adsorption on the surface of a phosphorylcho-
line-coated oxygenator fibre.
Fig. 4.
Protein adsorption on the surface of an uncoated
oxygenator fibre.