


 47 / 76

CARDIOVASCULAR JOURNAL OF AFRICA • Volume 27, No 6, November/December 2016
AFRICA
377
establishment of sufficient sedation, the heart was rapidly
removed and mounted by cannulation of the aorta, where after it
was exposed to a perfusion protocol containing periods of both
retrograde, as well as work-mode perfusion, as shown in Fig. 1.
Cardiac temperature was monitored throughout using a
thermal probe inserted into the coronary sinus and maintained
at a temperature of 36.5°C. Functional performance of the
hearts was determined by the timed measurement of coronary
flow (CF) during retrograde perfusion, as well as aortic output
(AO) and CF during work mode. A pressure transducer (Viggo
Spectromed) inserted into the aortic cannula was used to
determine heart rate, as well as intra-aortic pressure. Aortic
pressure and cardiac output (CO
=
AO
+
CF) were used to
determine left ventricular work performance, as described by
Kannengieser
et al
.
43
Following a suitable period of stabilisation,
the hearts were exposed to either 20 minutes of GI, or 35 minutes
of RI as described in the next section.
FTY720 was obtained from Cayman Chemical (product
number 10006292; Cayman Chemical, MI, USA). After
dissolving it in dimethyl sulfoxide (DMSO), it was administered
to the isolated hearts at a concentration of either 1 or 2.5
µ
M.
The DMSO never exceeded a final concentration of 0.03% (vol/
vol), i.e. 0.004 M. This concentration was lower than those
reported to be associated with toxicity
44
or changes in cardiac
function.
45
Both concentrations of FTY720 were administered to the
isolated rat heart for a period of 15 minutes directly prior to
(PreFTY) sustained ischaemia or at the onset of reperfusion
(PostFTY) (Fig. 1). Global ischaemia (GI) entailed the complete
cessation of perfusion of the heart for a period of 20 minutes,
at a temperature of 36.5°C. Function during reperfusion was
expressed relative to pre-ischaemic values and served as an
endpoint for the damage caused by ischaemia. RI was initiated
by occluding the left anterior descending coronary artery using
a silk suture to ensnare the proximal section of the artery and
closing it with two interlocking pieces of plastic tubing, thereby
rendering the tissue distal to the occlusion ischaemic [the area
at risk (AAR)], while the remainder of the heart still received
adequate perfusion [the viable area (VA)].
Following 35 minutes of RI, at a maintained temperature
of 36.5°C, the AAR was reperfused by opening the suture.
Following RI, FTY720 administration was initiated five minutes
before the end of ischaemia and progressed for the first 10
minutes of reperfusion. Both the extent of infarct development
as well as functional recovery were used to assess the effects of
this ischaemic stress.
Hearts were reperfused for a period of 35 minutes following
20 minutes’ GI, and for 60 minutes following 35 minutes’ RI.
Although many researchers in the field prefer longer periods
of reperfusion following RI, previous work in our laboratory
has shown that shorter periods of reperfusion did not influence
the relative degree of IFS development between groups.
46,47
Post-ischaemic function was assessed at 35 minutes’ reperfusion
following 20 minutes’ GI, and 40 minutes’ reperfusion following
RI.
Infarct size was determined as previously described.
48,49
Briefly, following the application of RI and a suitable period of
reperfusion, the suture surrounding the left coronary artery was
re-occluded and the heart was infused with 0.5% Evans blue dye,
administered through the aortic cannula. This then delineated
the VA (which received adequate perfusion throughout the
protocol) from the AAR (the portion of the heart that was
exposed to ischaemia, including infarcted tissue).
50,51
The heart was then promptly removed from the perfusion
apparatus and frozen at –20°C for later analysis. After no
more than five days, the frozen ventricles were cut into slices
of approximately 2 mm in thickness and stained with 1% w/v
triphenyltetrazolium chloride (TTC) in a phosphate buffer (pH
7.4) at room temperature. Triphenyltetrazolium chloride (TTC)
stains viable tissue a brick-red colour through its reaction with
active dehydrogenases.
51,52
After 15 minutes, the heart slices were
fixed in a 10% v/v formaldehyde solution. The final result was
slices of heart tissue stained blue (VA), red (viable tissue in the
AAR) and white (infarcted tissue in the AAR) (Fig. 2).
The surface areas of these zones were quantified using the
UTHSCSA ImageTool program (developed at the University
of Texas Health Science Center at San Antonio, Texas, which
is available from the internet at
http://ddsdx.uthscsa.edu/dig/itdesc.html) and the data for all the individual slices were added
together for each heart. For comparison of the data, IFS is
expressed relative to the AAR, while the degree of occlusion is
indicated by the AAR relative to the total area (AAR
+
VA).
For an overview of the determination of IFS in pre-clinical
experimental models see Csonka
et al
.
51
Graphed data calculated as follows:
Percentage IFS
=
[IFS (white)/AAR (white
+
red)]
×
100
Percentage AAR
=
[AAR (white
+
red)/total area]
×
100
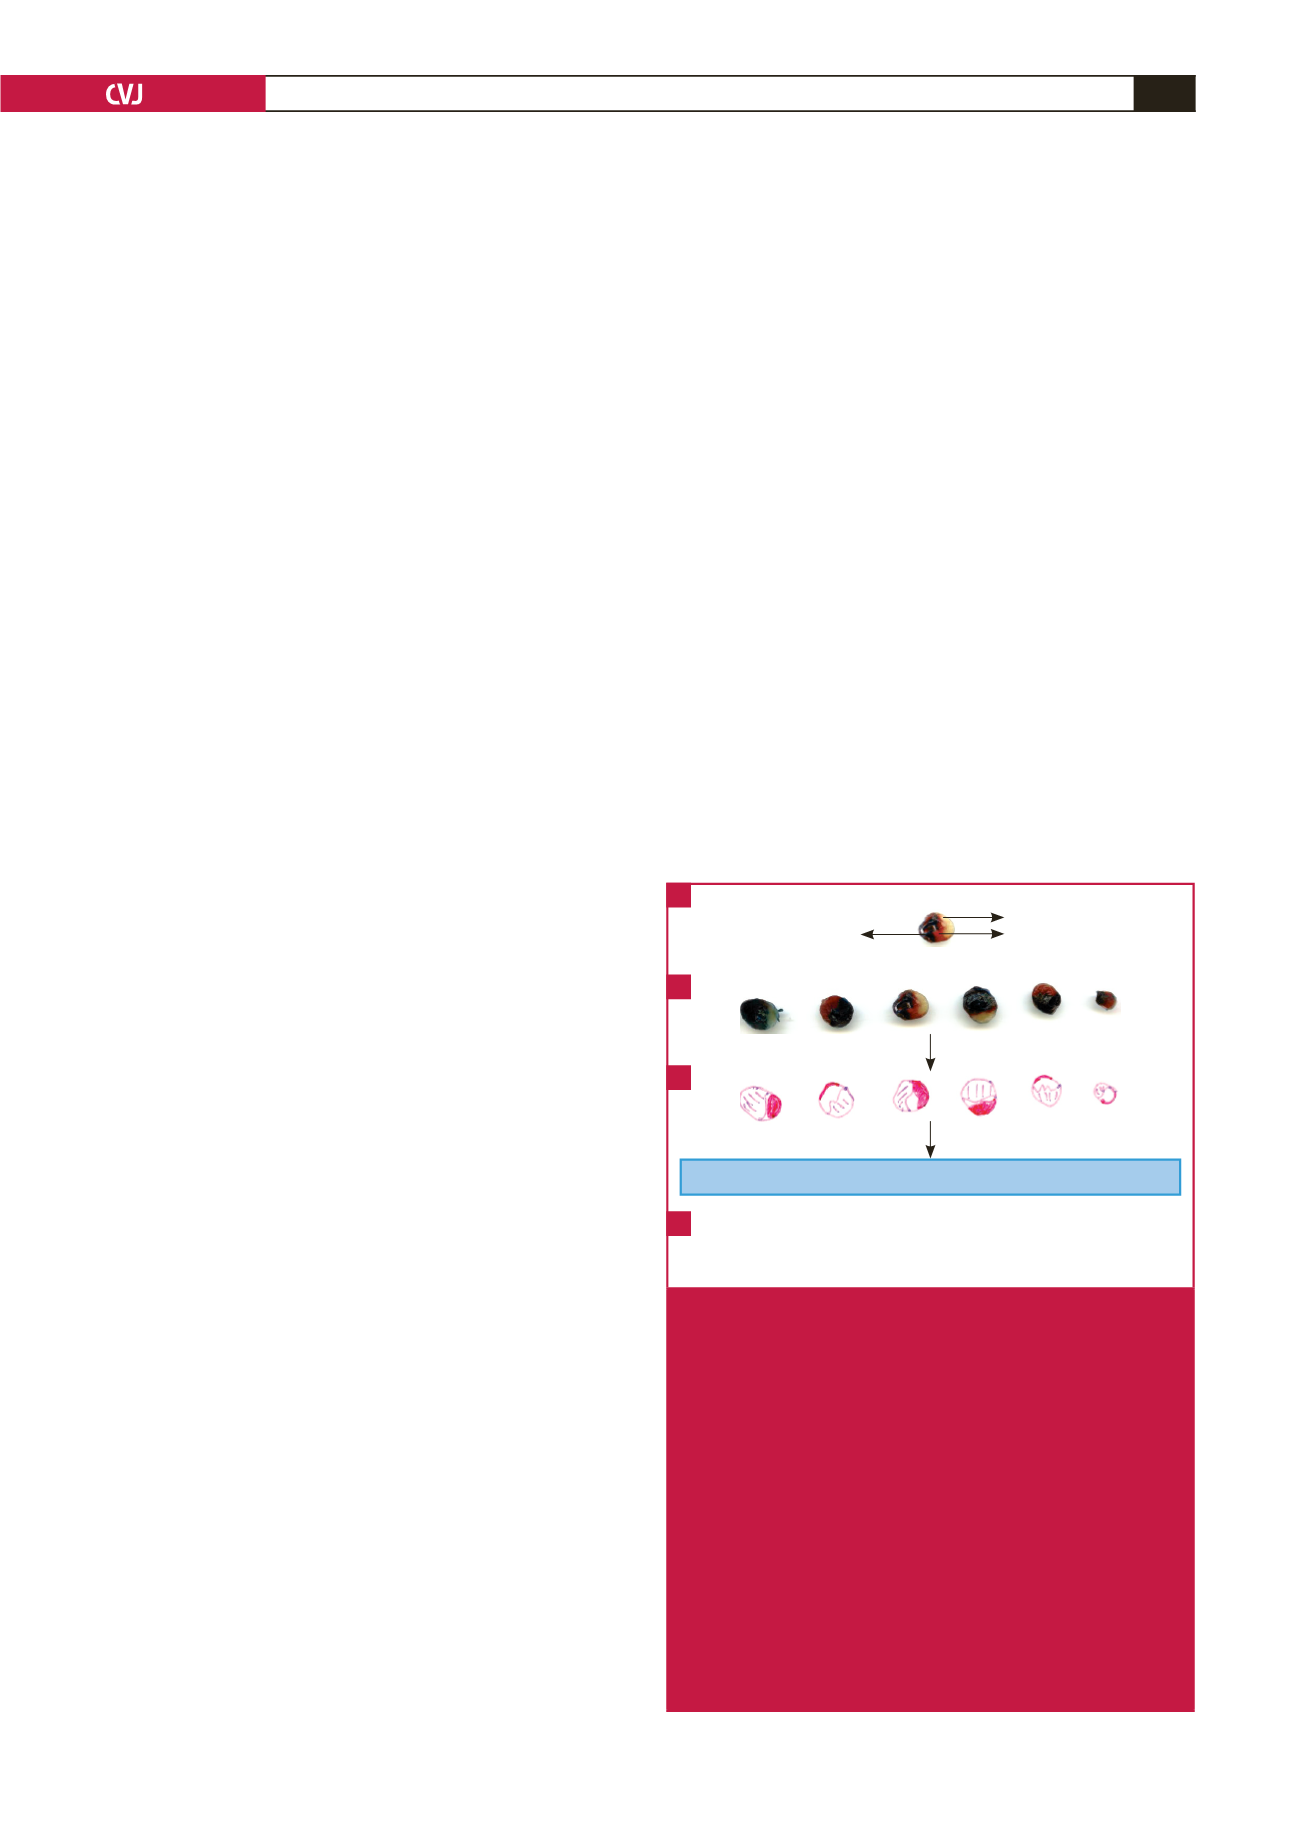
Blue tissue never
exposed to ischaemia
White infarcted tissue
Red viable tissue
in the area at risk
Quantification of surface areas using the UTHSCSA ImageTool program
Heart slices traced
Fig. 2
Graphic scheme illustrating the determination of infarct
size (IFS) using Evans blue dye and triphenyltetra-
zolium chloride (TTC) staining. A, B. Evans dye is
retrogradely injected through the aorta of the heart to
distinguish between tissue that has received adequate
perfusion (perfusing blue) and tissue exposed to
ischaemia. This ischaemic area is also called the area
at risk (AAR). It contains both infarcted tissue (white)
and viable tissue, which stains red in a reaction with
TTC. These three zones are then traced on an overlay-
ing transparency (C), which is then scanned and the
different areas determined using planimetry software.
D. The data that is finally used for statistical compari-
son is the infarct size expressed as a percentage of the
AAR, as well as the AAR expressed relative to the total
surface area. This latter parameter is an indication of
the degree of coronary occlusion.
A
B
C
D