


 50 / 76

CARDIOVASCULAR JOURNAL OF AFRICA • Volume 27, No 6, November/December 2016
380
AFRICA
PreFTY (1
µ
M): 1.60
±
0.08 AU and PreFTY (2.5
µ
M): 1.14
±
0.07 AU,
n
=
3–5;
p
<
0.05]. This effect was however transient,
with CF in the drug-treated groups returning to control levels
after 20 minutes of retrograde perfusion (Fig. 5C).
The effect of FTY720 in a model of 35 minutes’ RI
Although functional recovery is auseful endpoint, IFS is considered
by many workers to be the gold standard for evaluating the effects
of an intervention on I/R injury. We therefore also investigated the
effects of FTY720 administration on IFS following 35 minutes
of RI (Fig. 1). Although IFS was the primary endpoint for these
experiments, functional recovery was also recorded.
Pre-ischaemic functional patency of the hearts used for these
experiments is shown in Table 3. None of the experimental groups
differed from the control group prior to the administration of
FTY720 and the onset of regional ischaemia.
One of the advantages of a model of regional ischaemia is that
the functional ability of the hearts after the index ischaemia can
also be measured alongside the primary endpoint of IFS. Table 1
contains the functional values recorded at reperfusion. Similar to
our GI experiments, 1
µ
M of FTY720 failed to elicit any effect on
functional recovery following 35 minutes of RI (Fig. 7).
Table 3. Baseline functional ability of isolated rat hearts prior to
exposure to both 35 minutes’ regional ischaemia (RI),
as well as treatment with FTY720 (1 or 2.5
µ
M) either
before sustained ischaemia or during initial reperfusion
Group
Aortic output
(ml/min)
Cardiac output
(ml/min)
Total work
(mW)
Number
Control
48.33
±
3.56 62.83
±
4.34 13.46
±
1.13
6
1
µ
M FTY720
PreFTY
55.50
±
1.63 69.08
±
3.98 15.46
±
0.63
6
PostFTY
44.00
±
4.30 58.14
±
5.49 11.67
±
1.13
7
2.5
µ
M FTY720
PreFTY
47.00
±
3.53 63.17
±
4.39 13.02
±
0.98
6
PostFTY
52.33
±
3.20 69.42
±
3.94 14.62
±
0.87
6
Control
1
μ
M FTY 2.5
μ
M FTY
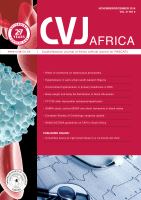
Coronary flow ratio
3.0
2.5
2.0
1.5
1.0
0.5
0.0
@
@
Coronary flow at the end of 15-minute drug
administration relative to stabilisation
Coronary perfusion at the end of 20 minutes’
retrograde reperfusion relative to stabilisation
Control
1
μ
M FTY 2.5
μ
M FTY
Coronary flow ratio
2.5
2.0
1.5
1.0
0.5
0.0
@
@
Retrograde
Work
Retrograde
Ischaemia
Retrograde
Work
Control
15
15
20
20 GI
20
15
PreFTY
15
15
20
20 GI
15 FTY
20
15
stabilisation
Fig. 6
The effect of the reperfusion administration of FTY720 on coronary flow (CF). FTY720 was associated with an increase in
CF, which was still evident five minutes after the cessation of drug administration.
@
p
<
0.01 vs control,
n
=
4–11.
A
B
Control
PreFTY PostFTY
Functional recovery (%)
50
40
30
20
10
0
Control
PreFTY PostFTY
Functional recovery (%)
60
50
40
30
20
10
0
Control
PreFTY PostFTY
Functional recovery (%)
60
50
40
30
20
10
0
Fig. 7
The effects of 1
μ
M FTY720, administered either before (PreFTY) ischaemia or at the onset of reperfusion (PostFTY), on
functional recovery following 35 minutes of regional ischaemia (RI) in terms of (A) aortic output, (B) cardiac output, and (C)
total work,
n
=
6–8.
A
B
C