


 26 / 80

CARDIOVASCULAR JOURNAL OF AFRICA • Volume 28, No 3, May/June 2017
160
AFRICA
dysfunction in the porcine carotid and coronary arteries.
15,16
Individuals with elevated Hcy levels are therefore at increased risk
of atherosclerosis and cardiovascular disease.
17-19
It is not clear whether ghrelin protects vascular tissue from
injury that is secondary to risk factors such as high levels of
Hcy. Levels of vitamin B
12
and folic acid, which form part of
Hcy metabolism, are in inverse correlation with the total Hcy
level. Nutritional deficiency or insufficiency of these vitamins
increases the risk of hyperhomocysteinaemia.
20,21
Saliva, which is among the biological fluids used in the
diagnosis of diseases, is also used to monitor treatment.
Companies that manufacture devices for diagnostic purposes
allocate a significant share to research and development efforts
geared towards the measurement of multiple parameters in the
saliva. This is because saliva is the most important biological
fluid that could be an alternative to using blood for analysis.
22
This study aimed to compare ghrelin, obestatin, Hcy, vitamin
B
12
and folate levels in the serum and saliva samples of ischaemic
heart disease patients and those of healthy individuals.
Methods
Patients who had acute coronary syndrome or types 1 and
2 diabetes mellitus, were extremely obese [body mass index
(BMI)
>
35 kg/m
2
], or had undergone invasive revascularisation
in the previous three months were not included in the study.
Additionally, individuals were excluded if they were found to
have a normal coronary anatomy on angiography but had signs
of heart failure and branch blocks on electrocardiography.
The study was carried out on 33 patients (female/male:
48.5/51.5%) with IHD and 28 BMI- and age-matched healthy
subjects (female/male: 45.5/54.5%). All subjects, including the
controls, underwent coronary angiography. IHD was defined
as a
≥
50% diameter stenosis, as diagnosed by angiography. The
control group was defined as those having normal coronary
arteries, as diagnosed by angiography. Written consent was
obtained before the study, together with the institutional ethics
committee’s approval of the study protocol (dated 29 August
2007, issue no. 13).
Hypertension, family history of IHD and smoking were
present in 48.5, 36.4 and 33.4% of patients, respectively, in the
IHD group. In the control group, 25, 21.4 and 21.4% of patients
demonstrated these risk factors. None of the healthy controls
had a family history of obesity or a history of abdominal surgery
or gastrointestinal disease. They had taken no medication for at
least seven days before sample collection.
All subjects were advised not to eat, smoke or drink (except
water) during the night before the saliva and blood sample
collection. Approximately 2 ml of saliva and 5 ml of blood
were taken from the enrolled subjects by the standard procedure
described by Hosoda
et al
.
23
Total and acylated ghrelin levels in the serum and saliva
samples were measured using an enzyme linked immunosorbent
assay (ELISA) kit (Linco Research). As desacylated ghrelin level
was calculated by subtracting the acylated ghrelin value from the
total ghrelin value, care was taken to use the same commercial
kits throughout the study.
Serum and saliva obestatin levels were determined using a
human obestatin enzyme immunoassay (EIA) kit made by the
Bachem brand (Peninsula Laboratories, LLC: a member of the
Bachem group, California, USA). Serum and saliva Hcy levels
were measured using an axis homocysteine EIA kit. Levels of
vitamin B
12
and folate were determined by a Roche Elecsys 2010
hormone analyser.
Statistical analysis
The data were statistically analysed using the SPSS for Windows
15.0 software package. First, continuous variables were
checked for normality. Upon finding deviations from a normal
distribution, the Mann–Whitney
U
-test was used to compare
the groups. Correlations between blood and saliva values were
established by calculating the Spearman correlation coefficient.
Mean
±
SD and median (min, max) values are presented
as descriptive statistics. Frequencies and percentage values
are presented for the categorical data. Pearson’s chi-squared
continuity correlation analysis was used in the comparison. A
p-
value
<
0.05 was accepted as significant.
Results
While the age, BMI, diastolic blood pressure, and triglyceride,
total cholesterol and low-density lipoprotein (LDL) cholesterol
levels were not significantly different between the control and
IHD groups (
p
>
0.05), systolic blood pressure (
p
=
0.019) and
high-density lipoprotein (HDL) cholesterol (
p
=
0.042) were
significantly lower in the IHD group (Table 1).
An intra-group comparison of serum and saliva levels of
total acylated and desacylated ghrelin, obestatin, vitamin B
12
and folate was conducted. These parameters were also compared
between the groups. Some differences were seen between serum
and saliva levels of the biochemical parameters when we carried
out intra- and inter-group comparisons (Table 1).
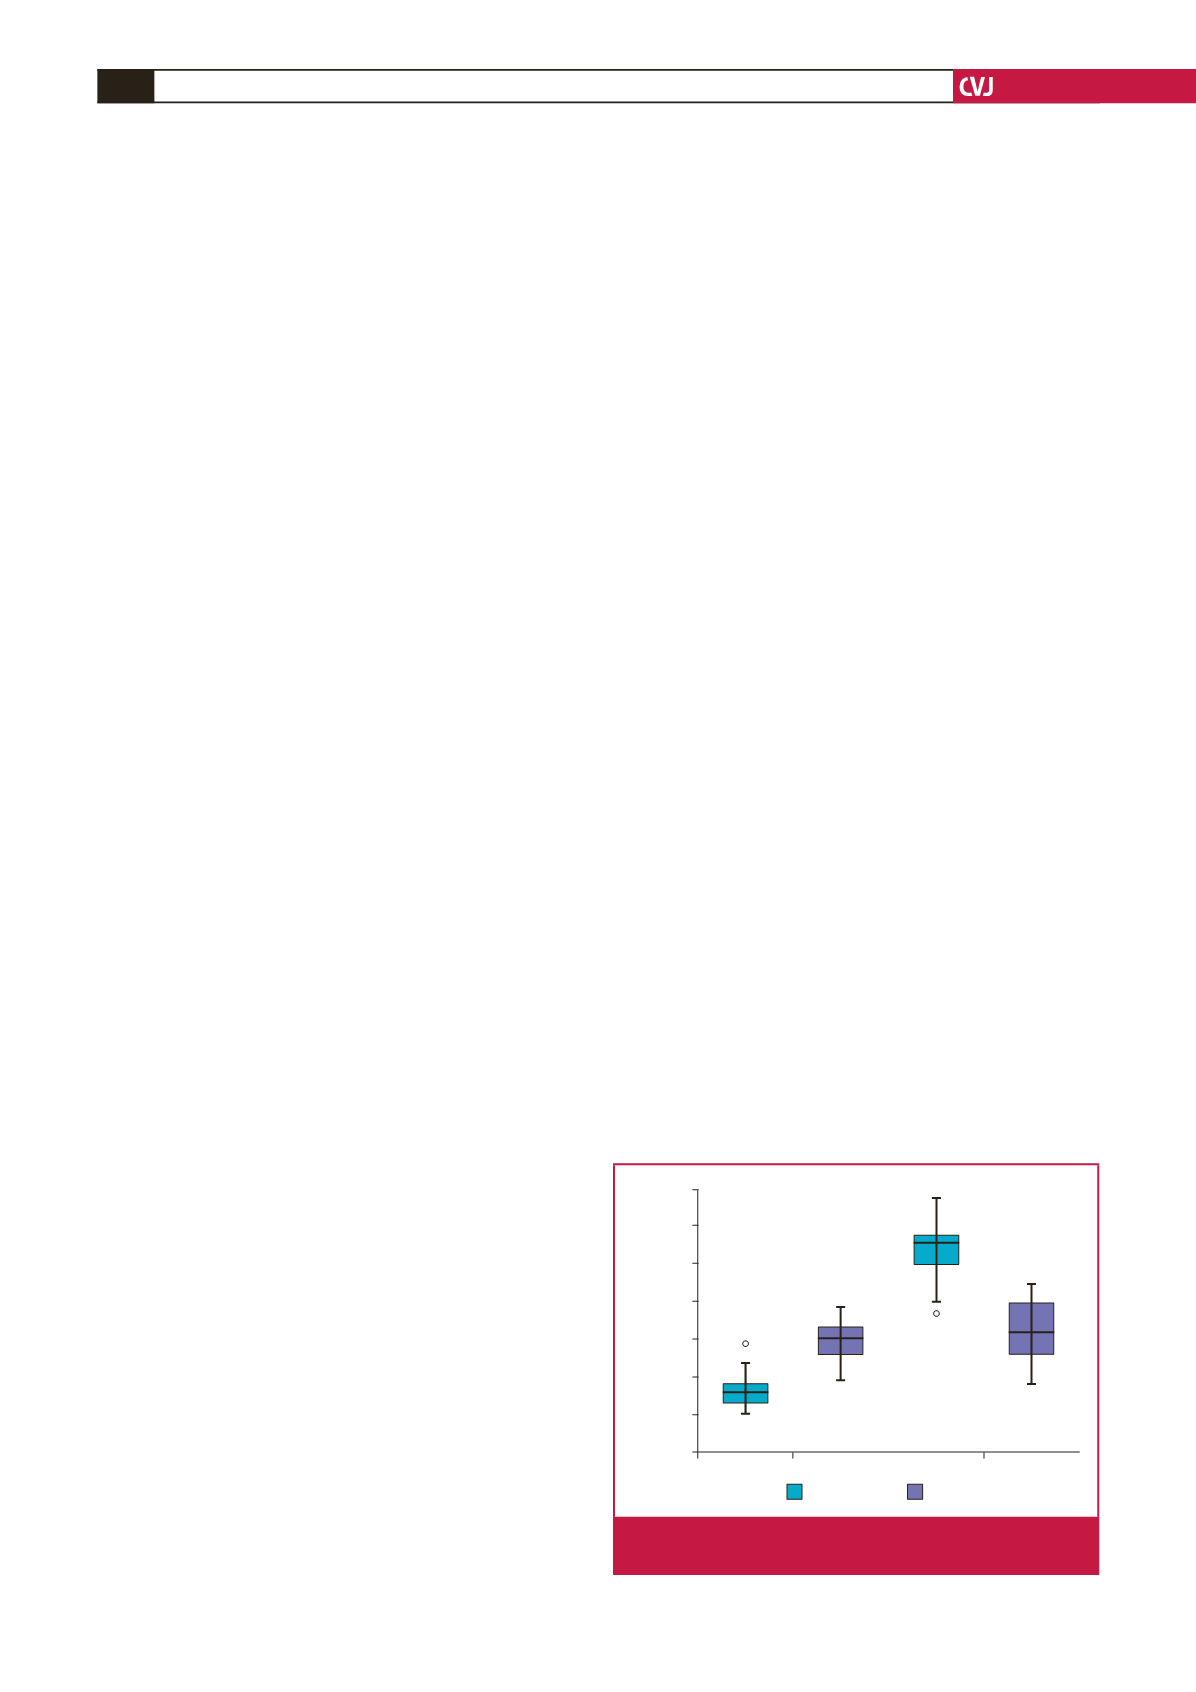
In the control group, saliva levels of total acylated and
desacylated ghrelin were higher than in the serum (
p
=
0.001).
Conversely, in the IHD group, serum levels were found to be
higher than in the saliva (
p
=
0.001) (Table 1, Fig. 1).
When serum and saliva levels of these parameters were
compared between the two groups, total ghrelin, desacylated
ghrelin and serum levels of Hcy and acylated ghrelin were found to
be higher in the IHD group (
p
=
0.001) (Table 1, Figs 1, 2). While
Control
IHD
70
60
50
40
30
20
10
0
Acyl ghrelin (pg/ml)
28
AG serum AG saliva
58
Fig. 1.
Serum and saliva acylated ghrelin levels of controls
and patients with ischaemic heart disease.