


 27 / 80

CARDIOVASCULAR JOURNAL OF AFRICA • Volume 28, No 3, May/June 2017
AFRICA
161
serum levels of obestatin were lower in the IHD group, saliva levels
were higher (
p
=
0.001) (Table 1, Fig. 3). Saliva and serum levels of
vitamin B
12
and folate were significantly lower in the IHD patients
in comparison with the control group (
p
=
0.001) (Table 1).
Discussion
Ghrelin is a 28-amino acid peptide that was initially identified
in rat stomachs.
12
In humans, it is mainly secreted from the
stomach and acts as the endogenous ligand for the growth
hormone secretagogue receptor (GHS-R).
24,25
There are two
subtypes of GHS-R: GHS-R subtype 1a (GHS-R1a) and
subtype 1b (GHS-R1b). GHS-R1a is the functionally active and
signal-transducing form.
26,27
It is expressed in many tissues, such
as pituitary and thyroid glands, pancreas and cardiovascular
tissues, including myocardial and endothelial cells.
9,10,25
Ghrelin has two major endogenous forms, acylated ghrelin
(A-Ghr) and unacylated ghrelin (DA-Ghr). A-Ghr can bind
GHS-R1a and exert biological functions, unlike the unacylated
form.
28
Obestatin is a 23-amino acid peptide that is co-secreted
with ghrelin from the stomach.
29
Although various groups
have reported that obestatin is able to reduce appetite, gastric
emptying and jejunal motility, and exert proliferative, survival
and anti-apoptotic effects in B-cells, its biological effects remain
highly controversial and need to be thoroughly investigated.
30,31
In this study, saliva levels of both acylated ghrelin and
obestatin were found to be higher than the serum levels in the
control group. In the IHD group, however, serum levels of
Table 1. Demographic characteristics, biochemical data and serum and saliva levels of
biochemical parameters of the controls and patients with ischaemic heart disease
Control
IHD
p
-value
Mean
±
SD
Med (min; max)
Mean
±
SD
Med (min; max)
Age
49.5
±
12.2
48.0 (25; 77)
50.5
±
11.0
49.1 (24; 75)
0.126
BMI (kg/m
2
)
25.1
±
3.1
25.6 (20.3; 32.8)
25.5
±
3.4
26 (21.4; 33.8)
0.860
Systolic blood pressure (mm/Hg)
116.8
±
10.1
120 (90; 140)
126
±
14.4
120 (100; 160)
0.019
Diastolic blood pressure (mm/Hg)
74.0
±
7.6
70 (60; 90)
75.8
±
70.1
80 (60; 90)
0.488
Triglycerides (mg/dl)
179.3
±
77.4
153 (83; 340)
169
±
86.5
157 (73; 491)
0.633
[mmol/l]
[2.03
±
0.87]
[1.73 (0.94; 3.84)]
[1.91
±
0.98]
[1.77 (0.82; 5.55)]
Total cholesterol (mg/dl)
177.1
±
24.7
172 (140; 210)
194
±
57.4
191 (120; 369)
0.128
[mmol/l]
[4.59
±
0.64]
[4.45 (3.63; 5.44)]
[5.02
±
1.49]
[4.95 (3.11; 9.56)]
LDL cholesterol (mg/dl)
121.2
±
21.7
126 (81; 152)
130
±
50.0
126 (73; 270)
0.761
[mmol/l]
[3.14
±
0.56]
[3.26 (2.10; 3.94)]
[3.37
±
1.30]
[3.26 (1.89; 6.99)]
HDL cholesterol (mg/dl)
39.1
±
6.3
38.5 (3; 54)
35.9
±
8.7
34 (22; 57)
0.042
[mmol/l]
[1.01
±
0.16]
[1.00 (0.08; 1.40)]
[0.93
±
0.23]
[0.88 (0.57; 1.48)]
Total ghrelin (pg/ml)
Serum
111.4
±
34.5
105.5 (49; 169)
316
±
82.4
311 (229; 627)
0.001
Saliva
205.8
±
30.8
218 (150; 242)
260
±
68.1
250 (98; 510)
0.001
Acylated ghrelin (pg/ml)
Serum
16.9
±
4.8
16 (10; 29)
53.8
±
7.9
56 (37; 68)
0.001
Saliva
29.6
±
5.5
31 (19; 39)
32.7
±
8.0
320 (18; 45)
0.101
Desacylated ghrelin (pg/ml)
Serum
93.8
±
31.4
89.5 (38; 145)
255
±
67.5
254 (171; 435)
0.001
Saliva
176.5
±
30.2
189.5 (119; 212)
220.2
±
43.1
211 (125; 314)
0.001
Obestatin (pg/ml)
Serum
399.5
±
83.7
406.5 (100; 503)
371
±
62.1
347 (303; 499)
0.020
Saliva
541.2
±
57.3
529 (455; 688)
588
±
63
597 (482; 692)
0.005
Homocystein (µmol/l)
Serum
9.4
±
1.4
9.2 (7.2; 12.6)
14.3
±
3.7
13.6 (8.4; 26)
0.001
Saliva
1.2
±
0.2
1.1 (1; 1.5)
1.2
±
0.1
1.2 (1; 1.5)
0.900
Vitamin B
12
(pg/ml)
Serum
255.1
±
54.4
250.6 (57.3; 330)
175
±
34.9
162.6 (133; 260)
0.001
Saliva
78.8
±
10.4
78.5 (63; 98.8)
58.6
±
7.4
59 (43.8; 80.2)
0.001
Folate (ng/ml)
Serum
7.3
±
1.3
6.8 (5; 9)
5.1
±
0.9
4.8 (4.0; 7.1)
0.001
Saliva
4.0
±
0.5
4.2 (3; 4.8)
2.9
±
0.8
2.7 (2.1; 5.1)
0.001
p
-values obtained by comparison of control and IHD groups.
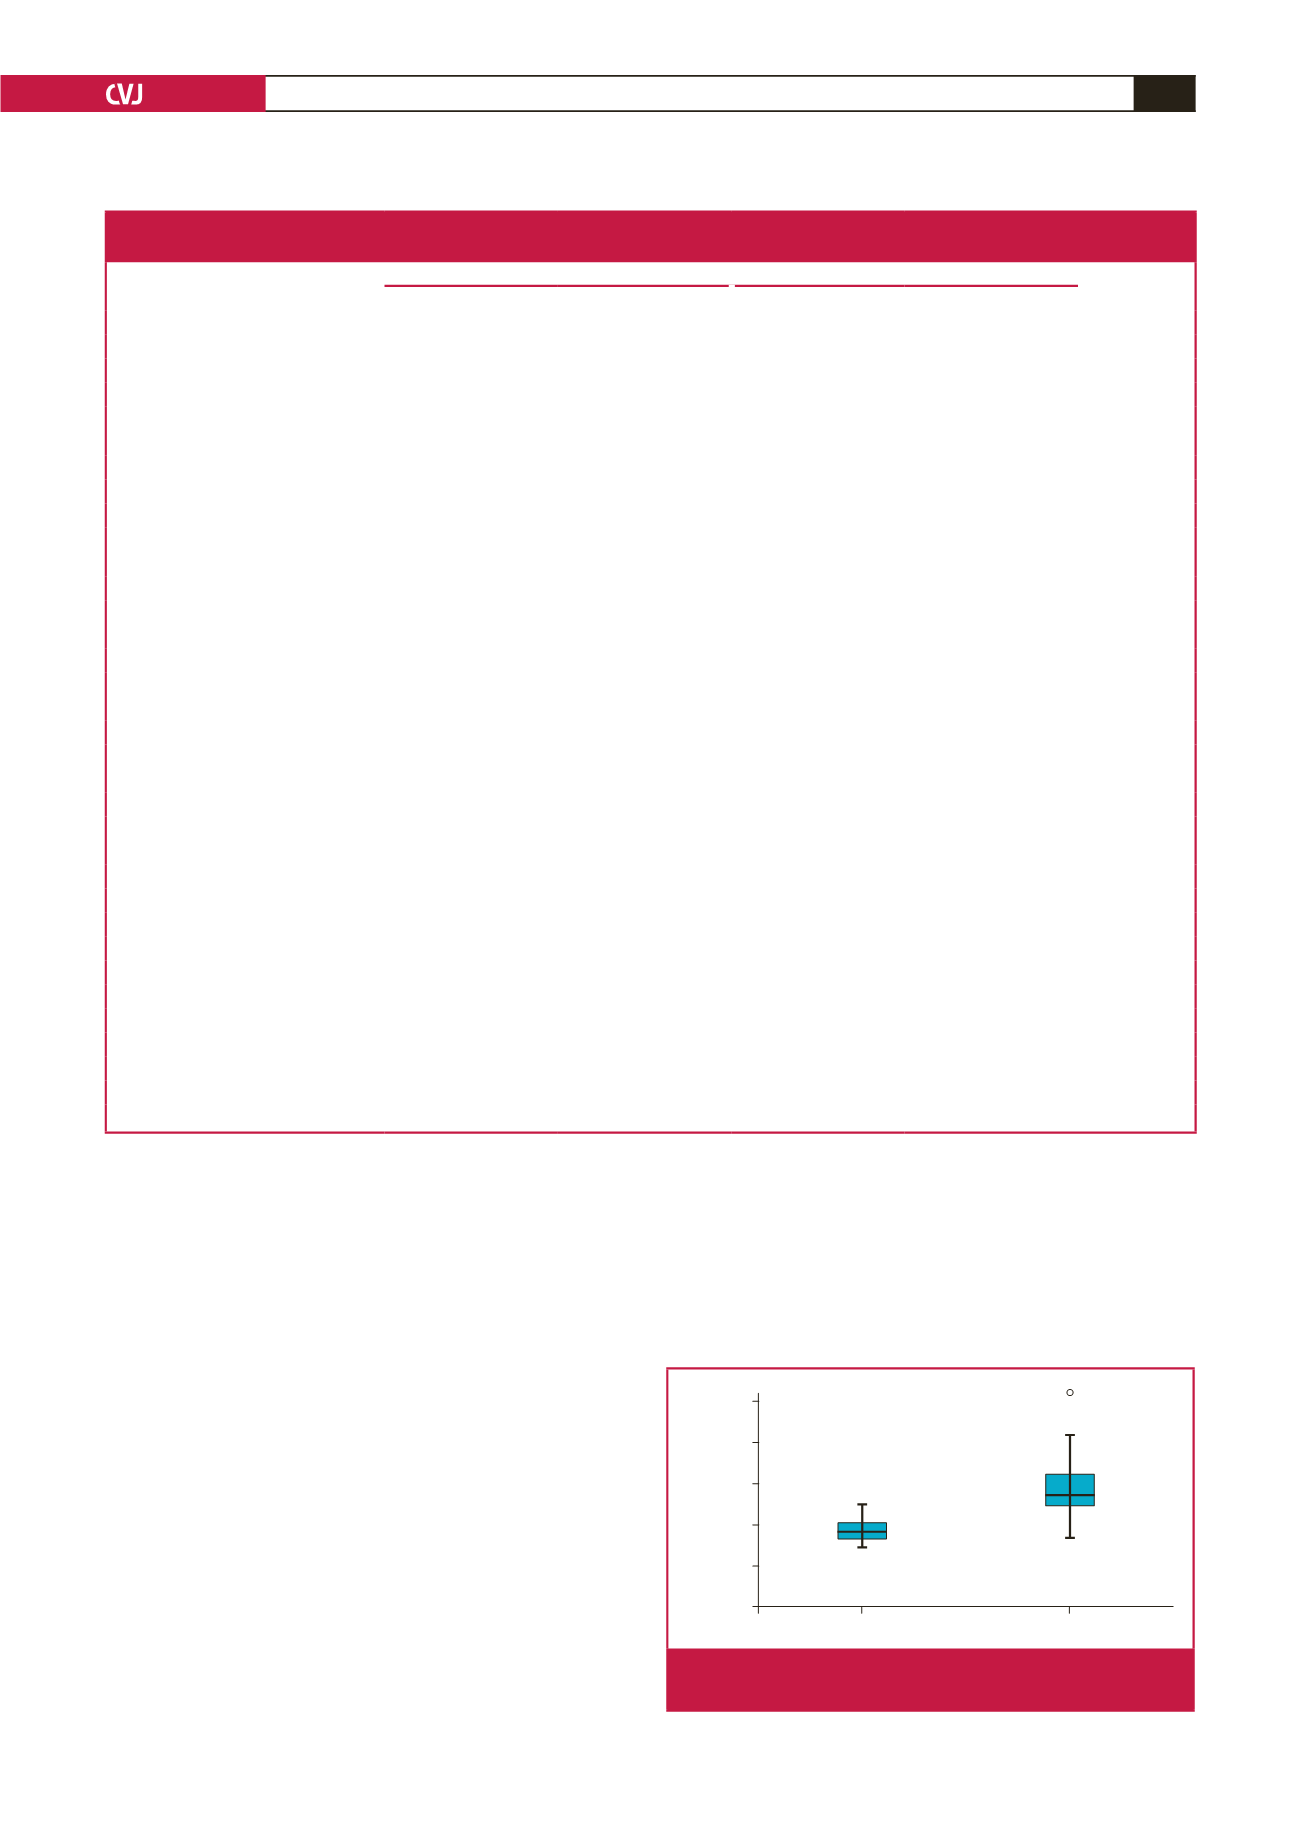
Control
IHD
25
20
15
10
5
0
Homocysteine serum (
μ
md/l)
30
Fig. 2.
Serum Hcy levels of controls and patients with ischae-
mic heart disease.