


 22 / 80

CARDIOVASCULAR JOURNAL OF AFRICA • Volume 28, No 3, May/June 2017
156
AFRICA
Multivariate linear regression analysis demonstrated that
the ESR (
β
=
0.289,
p
=
0.004) was an independent predictor of
a prolonged cTp-Te interval (Table 3). In addition there were
significant correlations between the cTp-Te/QT ratio in lead V5
and ESR (
r
=
0.422,
p
<
0.001) and CRP levels (
r
=
0.407,
p
<
0.001) and NLR (
r
=
0.207,
p
=
0.021) and mitral E/A ratio (
r
=
–0.189,
p
=
0.035).
Discussion
In the current study, we found that cTp-Te interval and cTp-Te/
QT ratio were significantly increased in the FMF group
compared to the control group. In addition we found that the
increased cTp-Te interval and cTp-Te/QT ratio were positively
correlated with CRP and ESR levels and NLR and mitral E/A
ratios. We also found that ESR was an independent predictor of
a prolonged cTp-Te interval in patients with FMF.
FMF is a hereditary transmitted auto-inflammatory disease
characterised by recurrent and paroxysmal fever, peritonitis,
pericarditis, arthritis and skin rashes.
1
Some researchers have
shown that subclinical inflammation continues not only during
attacks, but also during the attack-free periods in patients
with FMF.
17,18
Ongoing, low-grade inflammation in chronic
inflammatory diseases leads to deterioration of endothelial
function, myocarditis, vasculitis and fibrosis of the heart
Table 2. Electrocardiographic findings in patients
with FMF and controls
FMF patients
(
n
=
66)
Controls
(
n
=
58)
p
-value
Heart rate (beat/min)
75.3
±
10.6
78.4
±
12.6 0.141
QT interval (ms)
V2 351.7
±
19.7 347.3
±
22.8 0.256
V5 352.3
±
19.9 347.3
±
22.8 0.291
QT dispersion
21.6
±
9.4
20.7
±
8.9
0.572
QTc interval (ms)
V2 391.0
±
22.6 396.7
±
31.5 0.247
V5 391.7
±
23.6 397.5
±
32.2 0.252
QTc dispersion
24.0
±
10.2
23.9
±
10.3 0.931
Tp-Te interval (ms)
V2 97.4
±
10.0
88.0
±
5.7
<
0.001
V5 93.3
±
7.7
86.6
±
10.2
<
0.001
cTp-Te interval (ms) V2 108.7
±
12.5 100.2
±
9.7
<
0.001
V5 104.2
±
11.1
99.0
±
13.9 0.023
cTp-Te/QT ratio (ms) V2 0.31
±
0.04
0.29
±
0.03 0.004
V5 0.29
±
0.04
0.27
±
0.03 0.009
QTc
=
corrected QT; Tp-Te
=
T-wave peak-to-end interval; cTp-Te:
corrected Tp-Te. Data are presented as mean
±
SD.
Control
FMF
160
140
120
100
80
60
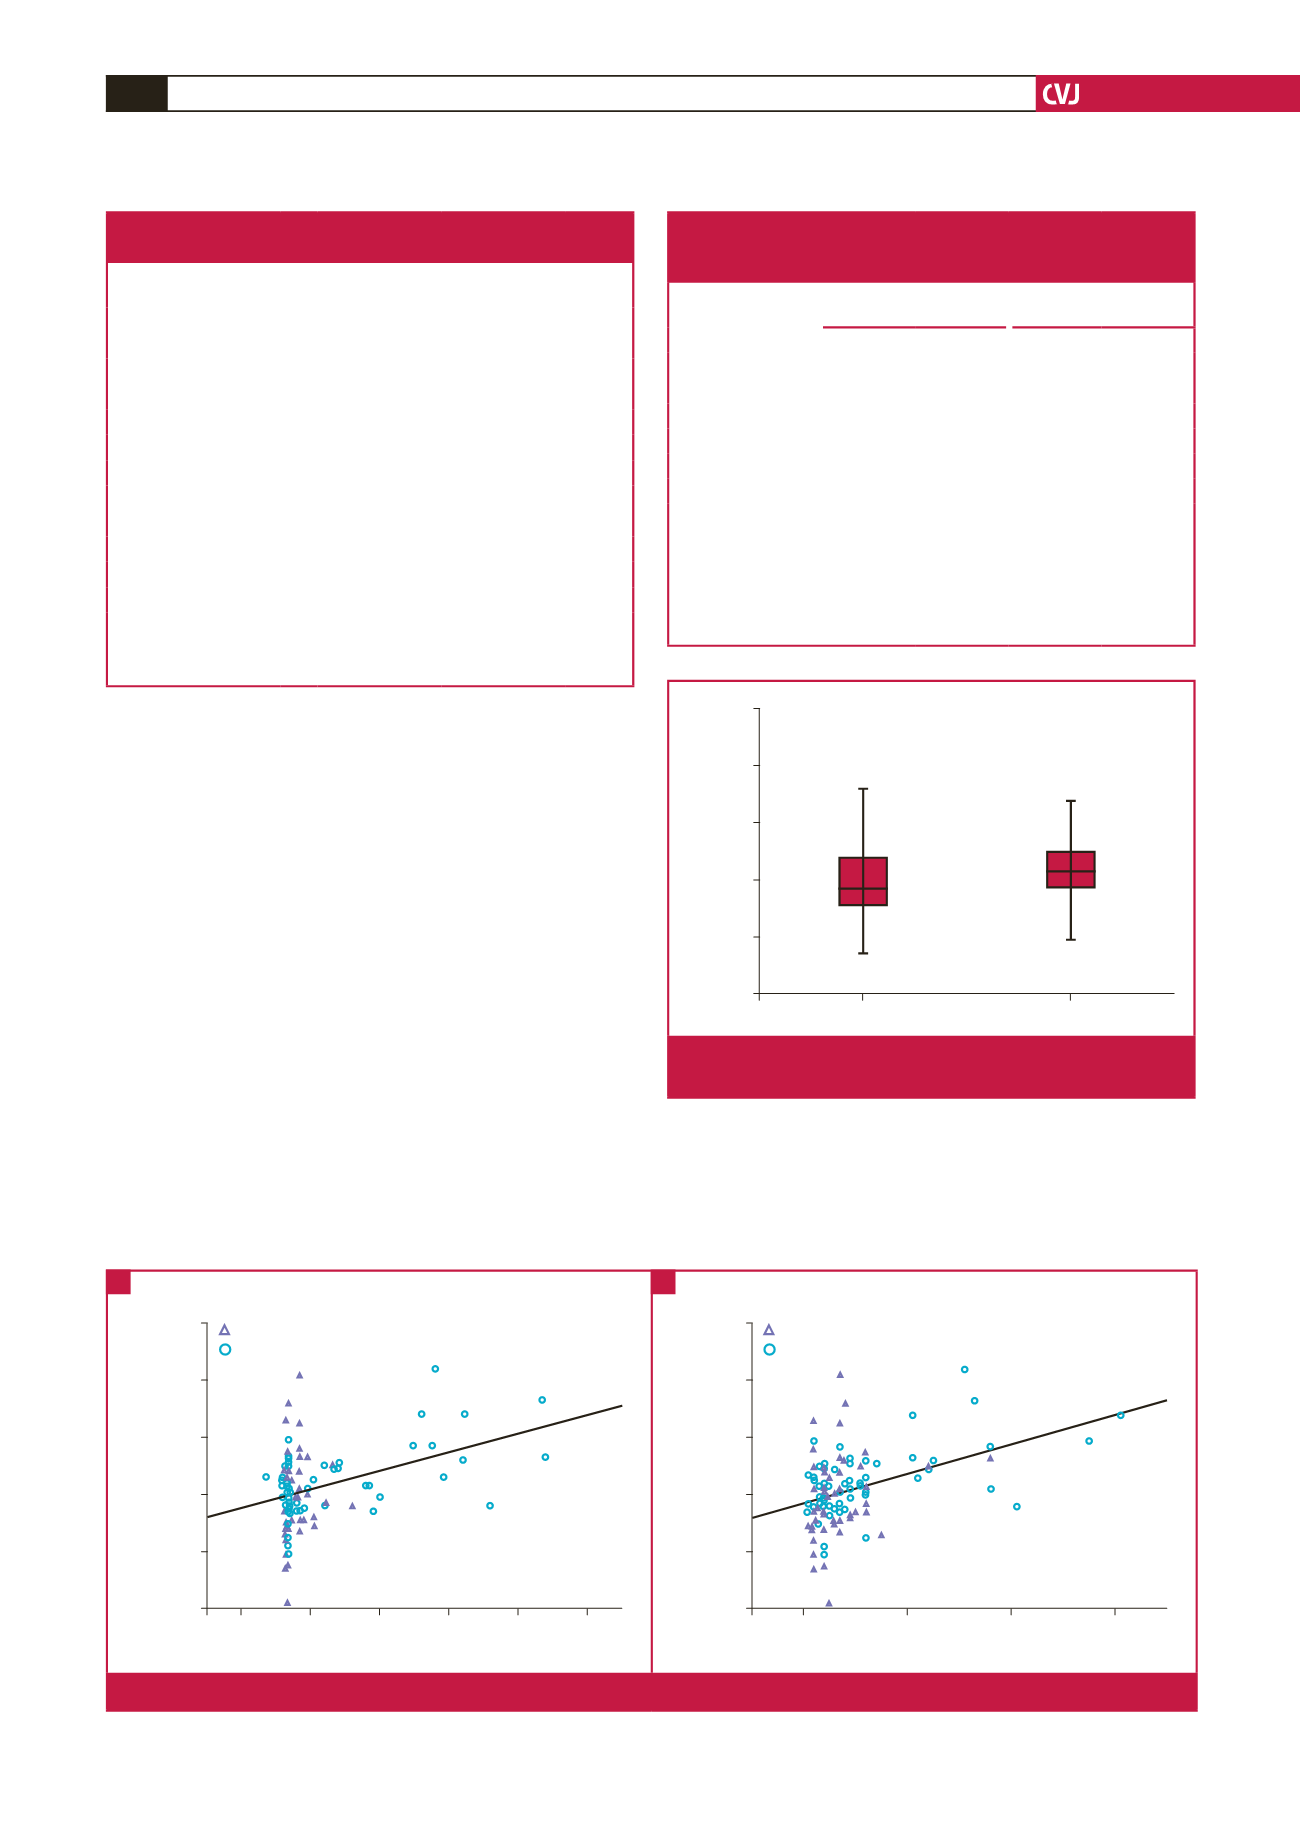
cTp-Te V5 (ms)
Fig. 1.
Box plot shows the cTp-Te values of FMF patients and
controls.
Table 3. Bivariate correlation and multivariate linear
regression analyses between prolonged cTp-Te interval
(lead V5) and study parameters
Bivariate correlation
Multivariate linear
regression
Parameters
r
p
-value
β
p
-value
ESR
0.418
<
0.001
0.289
0.004
CRP
0.382
<
0.001
0.179
0.070
NLR
0.192
0.033
0.121
0.176
E/A ratio
–0.190
0.034
–0.060
0.486
Body mass index
0.165
0.067
0.074
0.387
WBC count
0.163
0.071
0.062
0.487
Age
0.063
0.484
–
–
LVEF
–0.032
0.721
–
–
Female
–0.140
0.120
–
–
CRP
=
C-reactive protein; ESR
=
erythrocyte sedimentation rate;
LVEF
=
left ventricular ejection fraction; NLR
=
neutrophil–lympho-
cyte ratio; WBC
=
white blood cell.
0.0
5.0
10.0 15.0 20.0 25.0
160
140
120
100
80
60
cTp-Te V5 (ms)
CRP (mg/l)
Control
FMF
r
=
0.382,
p
<
0.001
0
20
40
60
160
140
120
100
80
60
cTp-Te V5 (ms)
Erythrocyte sedimentation rate
Control
FMF
r
=
0.418,
p
<
0.001
Fig. 2.
Correlations between cTp-Te interval and C-reactive protein (A), and erythrocyte sedimentation rate (B) levels.
A
B