


 15 / 78

CARDIOVASCULAR JOURNAL OF AFRICA • Volume 28, No 6, November/December 2017
AFRICA
353
adherence scale was 6.1 (
±
1.8). The item-total correlations were
>
0.44 for each of the eight items composing the medication
adherence scale. The internal consistency using Cronbach’s
alpha was 0.76.
Multivariate logistic regression analysis revealed
three independent variables had a significant influence on
non-adherence to medication use. Respondents with high
levels of education, low or middle income levels and those
who taking five or more medications daily were found to be
more non-adherent to medication use than those with low–
intermediate education levels (
p
<
0.001), those with high income
levels (
p
<
0.001), and those taking one to four medications daily
(
p
=
0.039). Table 4 shows the results of the multivariate analysis
for factors associated with high adherence to medication use.
The reasons for poor medication adherence among the study
participants were found to be the expensive cost of drugs (
n
=
210; 54.4%; 95% CI: 49.3–59.4), polypharmacy (
n
=
204; 52.8%;
95% CI: 47.7–57.9), lack of pharmacist’s communication with
them regarding the instructions and importance of taking the
drug regularly (
n
=
193; 50.0%; 95% CI: 44.9–55.1), lack of
physician’s communication with them regarding their illness and
the benefit that the medication will provide (
n
=
156; 40.4%; 95%
CI: 35.5–45.5), bothered by side effects associated with their
medications (
n
=
142; 36.8%; 95% CI: 32.0–41.8), and irregular
availability of the drugs in their areas (
n
=
129; 33.4%; 95% CI:
28.8–38.4).
Discussion
This is the first known study to be conducted among patients
attending the three largest cardiac centres in Khartoum State to
evaluate their level of adherence to cardiovascular medications,
and to identify predictors and barriers of non-adherence. These
findings would be the first step to provide a better understanding
of medication adherence among cardiac patients in Khartoum
State, and are valuable for policy makers and clinicians to inform
future services. These results could be utilised in designing
targeted strategies to improve adherence and to minimise the
adverse outcomes associated with non-adherence to medications.
A very worrisome finding in this study was the highly
prevalent self-reported medication non-adherence among the
study population (51%), compared to that reported in two
previous studies (34 and 40.4%, respectively) in Khartoum
State.
15,16
The current study provides more valid and meaningful
results due to the use of an appropriate sample size, sampling
strategy, validated MMAS-8, and its inclusion of patients with
variant cardiovascular conditions in multicentre out-patient
cardiac clinic settings covering the three largest cardiac referral
centres in Khartoum State.
The present findings are within prevalences reported in
developed and developing countries, which ranged between 31
and 60%.
4,5,9,14
The high non-adherence rate demonstrated by this
study is of particular concern as a potential contributing factor
to poor clinical outcomes, including rehospitalisation, increased
mortality rates and increased healthcare costs,
6-8
and underscores
the urgent need for its improvement in order for cardiac patients
to derive the maximal benefit of their prescribed medications.
In our survey, levels of income and education, and
polypharmacy were found to be significant predictors for
non-adherence to cardiovascular medications. Medication
non-adherence was significantly higher among low- and middle-
income groups compared to the high-income group, which
is consistent with previous studies.
10,14
This finding may be
attributed to the precipitous increase in living costs in Sudan
during the last three years, which may have led some patients
with cardiovascular diseases to consider their medication costs
as a lower-priority option. Other possible reasons include the
prescribing of expensive, proprietary medications instead of
generics, poor health insurance coverage, and bureaucratic
processes associated with insurance claims.
The current finding highlights the need for the implementation
of appropriate tools to determine the patient’s ability to afford
the cost of medications since many patients may be embarrassed
to admit that they are having trouble affording medications;
and the establishment of programmes that involve partnerships
between patients, healthcare providers and payers to help
patients plan for payment of medication. Also eliminating
co-payments and out-of-pocket medication costs for patients
with low and middle incomes may be a viable component of
future interventions.
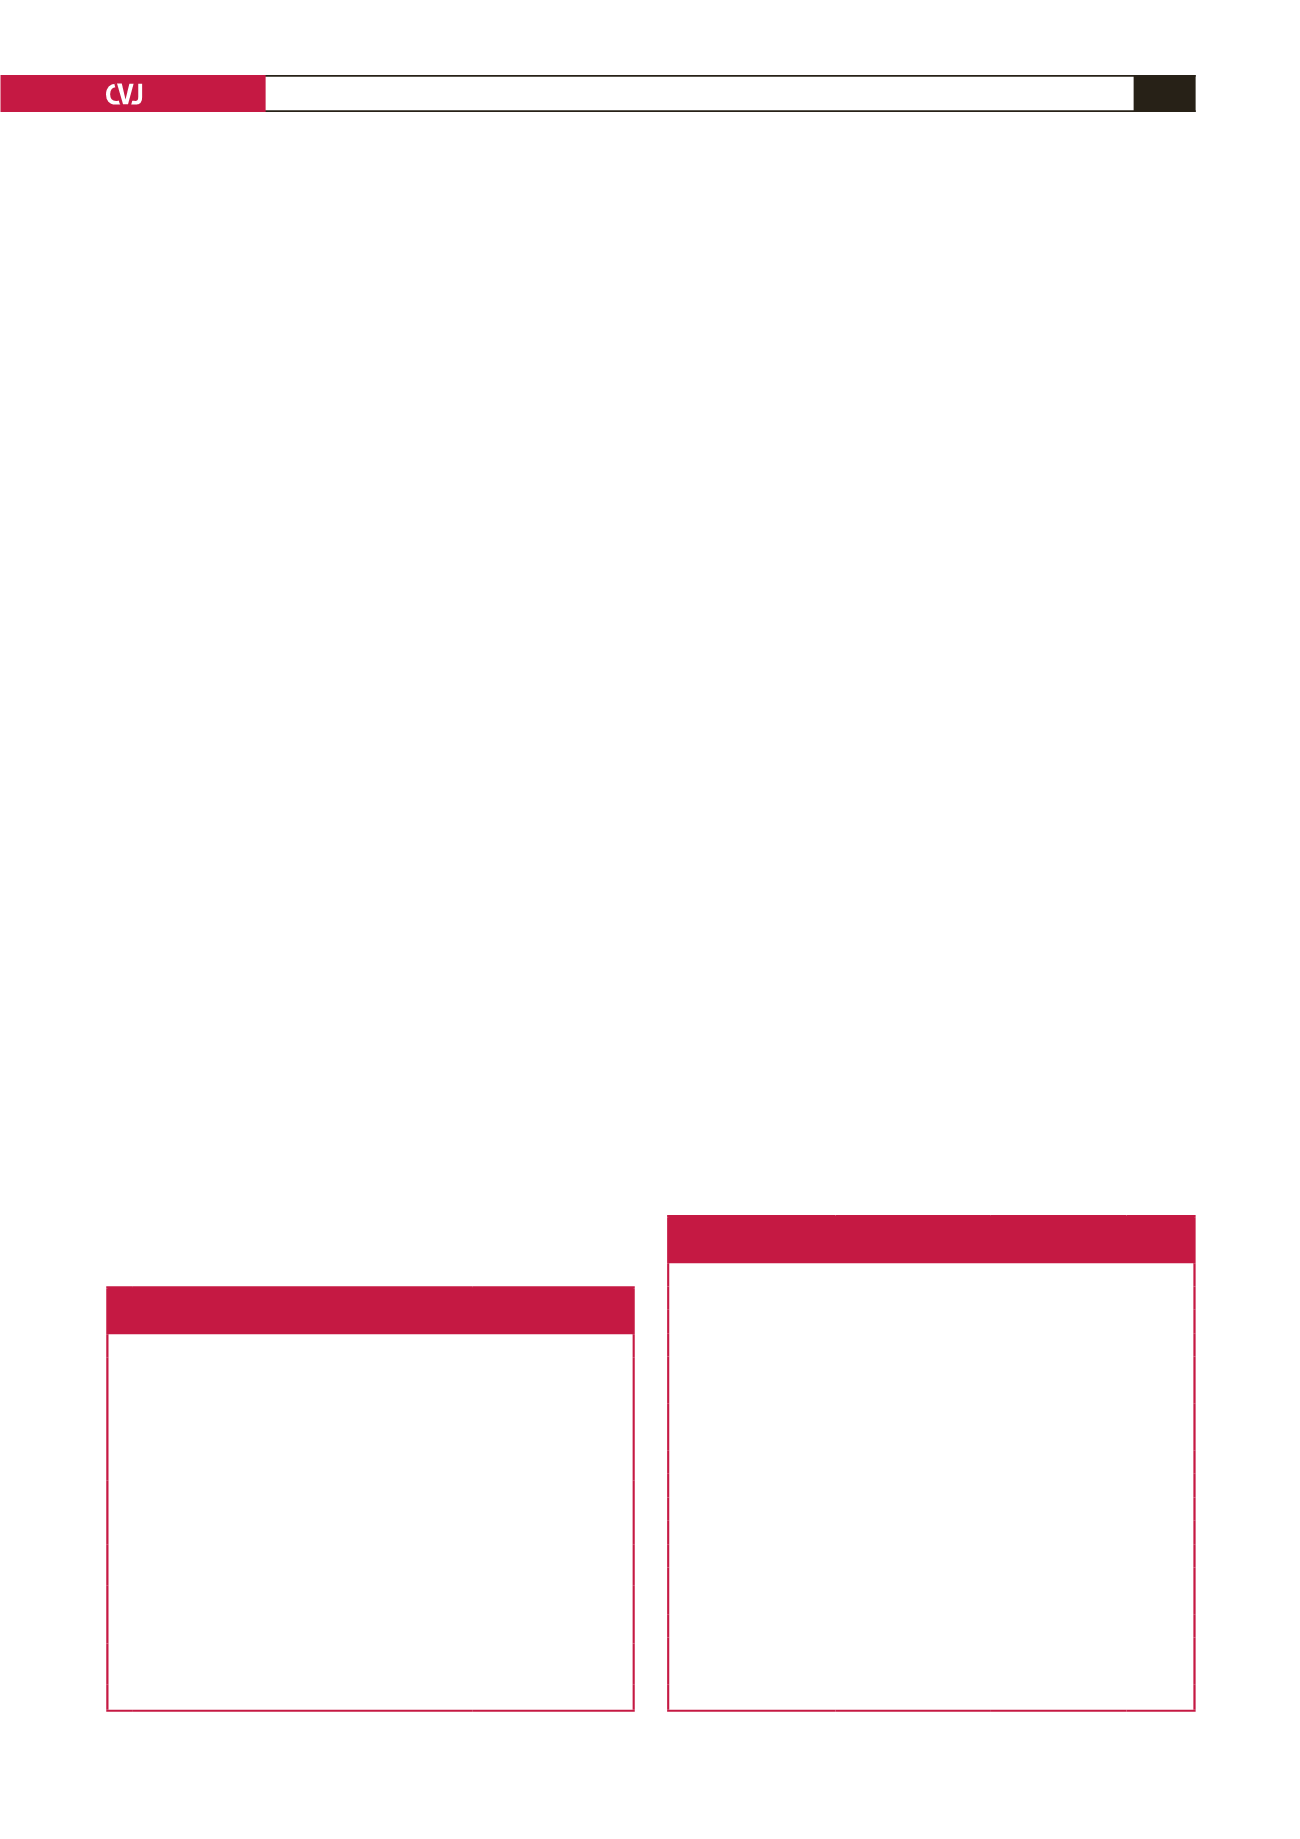
Table 3. Distribution of responses to the eight-item Morisky medication
adherence scale among the participants (
n
=
386)
Item
Yes,
n
(%; 95% CI)
1 Do you sometimes forget to take your pills?
133 (34.5; 29.8–39.5)
2 Over the past two weeks, were there any days when
you did not take your medicine?
75 (19.4; 15.7–23.8)
3 Have you ever cut back or stopped taking your
medication without telling your doctor because
you felt worse when you took it?
140 (36.3; 31.5–41.3)
4 When you travel or leave home, do you sometimes
forget to bring along your medications?
90 (23.3; 19.3–27.9)
5 Did you take your medicine yesterday?
375 (97.2; 94.8–98.5)
6 When you feel better, do you sometimes stop
taking your medicine?
58 (15.0; 11.7–19.1)
7 Taking medication every day is a real inconve-
nience for some people Do you ever feel hassled
about sticking to your treatment plan?
194 (50.3; 45.2–55.4)
8 How often do you have difficulty remembering to
take all your medication?*
112 (29.0; 24.6–33.9)
*
n
(%) of once in a while, sometimes, usually, and all the time
Table 4. Association between non-adherence and
respondents’ characteristics (
n
=
386)
Characteristics
Poor adherence,
n
(%) OR (95% CI)
p
-value
Age (years)
0.25
18–39
32 (40.5)
0.8 (0.4–1.4)
40–49
22 (52.4)
1.1 (0.5–2.3)
50–59
61 (61.6)
1.6 (0.9–2.8)
≥ 60
82 (49.4)
Reference
Educational level
<
0.001
Low–intermediate
152 (48.3)
0.3 (0.2–0.6)
High
45 (63.4)
Reference
Monthly income
<
0.001
Low
84 (60.0)
6.6 (3.6–12.3)
Middle
88 (64.7)
5.7 (3.1–10.5)
High
25 (22.7)
Reference
Number of diseases
0.79
1–2
111 (47.4)
1.1 (0.6–1.9)
≥ 3
86 (56.6)
Reference
Number of medications
1–4
99 (45.8)
0.6 (0.3–0.9)
≥ 5
98 (57.6)
Reference
0.039