


 35 / 78

CARDIOVASCULAR JOURNAL OF AFRICA • Volume 28, No 6, November/December 2017
AFRICA
373
patient with PH, we describe the clinical context of presentation
and confirmation of PH. The control subjects were younger with
a mean age of 36
±
10 years and 48 (16%) were men.
Table 1 summarises the demographic, clinical and echo-
cardiographic profile comparing men and women in the patient
group. Significant gender differences were seen, with a higher
prevalence of male smokers (47.6 vs 6.8%;
p
<
0.001) and better
performance in the males during the six-minute walking test (352
±
97 vs 254
±
142 m,
p
=
0.017).
Based on the WHO classification of PH, group 2 (venous PH)
was the most prevalent (46%), followed by group 1 (PAH) (31%),
group 3 (hypoxic PH) (22%) and group 5 (miscellaneous PH)
(3%). In all, 55.4% of patients presented in the WHO functional
class III or IV and the mean Karnofsky performance score was
67
±
17%.
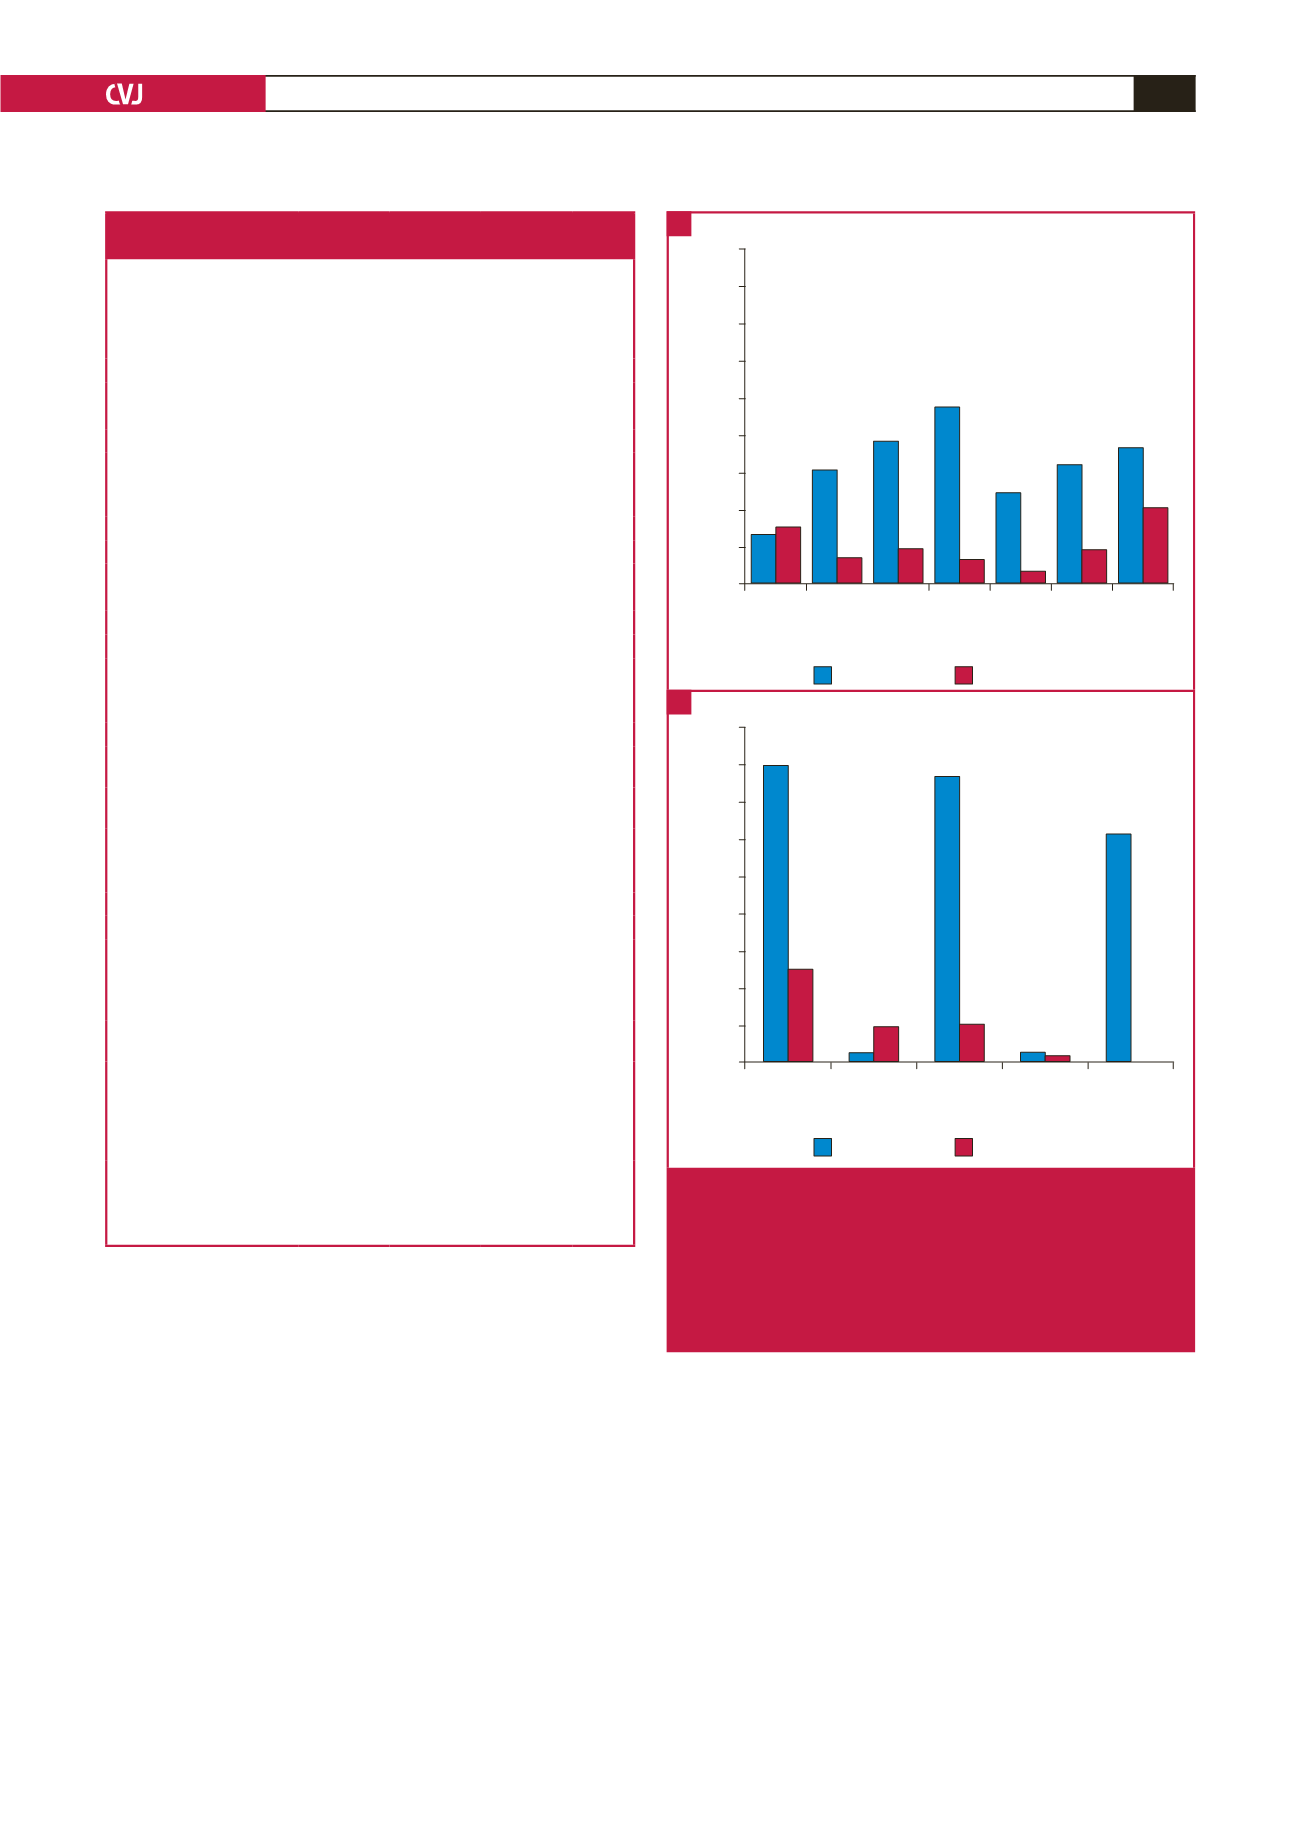
Compared to the control group, nearly all abnormalities were
much more frequent in our PH cohort. As shown in Fig. 4A,
the most prevalent (case vs control) major abnormalities were:
pathological Q wave (47.7 vs 6.7%), followed by left ventricular
hypertrophy (LVH) (38.5 vs 9.8%) and p-pulmonale (36.9 vs
20.7%). None of the patients had a completely normal ECG, as
opposed to 15% in the control group.
Of the minor ECG abnormalities (Fig. 4B), tachycardia (40
vs 12.6%) and QRS axis
≥
100° (38.5 vs 5.3%) were the most
prevalent. In all, 58.5% of the PH group vs 76.5% of the controls
were in sinus rhythm. Bradycardia (1.5 vs 4.9%) and right bundle
branch block (RBBB) with QRS right-axis deviation (1.5 vs
1.1%) were the least prevalent. Overall, in the PH group, 32.3%
had at least three or four major abnormalities and 24.6% had
three or four minor abnormalities. The respective numbers in the
control group were 4.2 and 0%.
Table 1. Demographic, clinical and echocardiographic profile of
patients with PH in the PAPUCO registry
Profile
All
(
n
=
65)
mean
±
2SD,
n
(%)
Male
(
n
=
21)
mean
±
2SD,
n
(%)
Female
(
n
=
44)
mean
±
2SD,
n
(%)
p
-value
Sociodemographic profile
Mean age (years)
43
±
15
47
±
14
41
±
15
0.133
Smoking
<
0.001
Never smoked
44 (67.7)
9 (42.9)
35 (79.5)
Ex-smoker
8 (12.3)
8 (38.1)
0 (0)
Current smoker
5 (7.7)
2 (9.5)
3 (6.8)
Previous or current
pulmonary tuberculosis
21 (32.3)
7 (33.3)
13 (29.5)
0.536
Clinical presentation
Dizziness
22 (33.8)
4 (19)
18 (40.9)
0.120
Shortness of breath
56 (86.2)
19 (90.5)
37 (84.1)
0.473
Body mass index (kg/m
2
)
23.7
±
5.8 24.1
±
6.5 23.5
±
5.5 0.690
Heart rate (bpm)
93
±
19 91.6
±
10.2 94.7
±
5.8 0.195
Pulse oximetry at rest (%) 93.8
±
7.5 94.7
±
5.8 91.6
±
10.2 0.156
Abnormal respiration at
rest,
n
(%)
15 (23.1)
5 (23.8)
10 (22.7)
0.861
Systolic BP (mmHg)
117
±
22 123
±
27 114
±
14
0.186
Diastolic BP (mmHg)
78
±
16
82
±
19
77
±
14
0.238
WHO functional class
III or IV
36 (55.4)
13 (61.9)
23 (52.3)
0.323
Karnofsky performance
score (%)
67
±
17
69
±
15
67
±
18
0.717
Distance walked in 6-min
walking test (m)
280
±
138 352
±
97 254
±
142 0.017
Jugular venous distension
56 (86.2)
19 (90.5)
37 (84.1)
0.591
Peripheral oedema
40 (61.5)
13 (61.9)
27 (61.4)
0.594
Main echocardiography characteristics
Right ventricular systolic
pressure (mmHg)
61.4
±
19.8 60.5
±
24.6 61.8
±
17.2 0.797
Tricuspid annular plane
systolic excursion (mm)
14.9
±
5
14.7
±
5.8
15
±
4.5 0.844
Left ventricular ejection
fraction (%)
51.6
±
20
48
±
17.5 53.2
±
21
0.357
Mean left ventricular
end-diastolic diameter
(mm)
49.6
±
12.3 52.4
±
9.9 48.1
±
13.2 0.210
Right ventricular
enlargement
56 (86.2)
18 (85.7)
38 (86.4)
0.335
Right atrial enlargement
57 (87.7)
19 (90.5)
38 (86.7)
0.830
Data are % or mean
±
SD;
p
-values based on the
t
-test, chi-squared or Fisher’s
exact test as appropriate; statistical significance is based on
p
<
0.05. BP, blood
pressure; WHO, World Health Organisation.
Major
T-wave
abnormal-
ity
Arrhyth-
mia***
LVH*** Patho-
logical Q
wave***
Prolonged
QTc inter-
val***
LBBB
or other
conduction
delay***
p-pulmo-
nale**
Proportion of patients with major abnormalities (%)
90
80
70
60
50
40
30
20
10
0
PH group
control group
Tachycardia
***
Bradycardia QRS right-
axis devia-
tion***
RBBB and
QRS right-
axis deviation
Right ventric-
ular hyper-
trophy***
Proportion of patients with minor abnormalities (%)
45
40
35
30
25
20
15
10
5
0
PH group
control group
Fig. 4.
Prevalence of major (A) and minor (B) ECG abnor-
malities in 65 patients with pulmonary hypertension in
the PAPUCO registry compared to 285 controls with
normal Doppler echocardiography and right ventricu-
lar systolic pressure. RBBB; right bundle branch block,
QRS right-axis deviation
=
QRS axis
>
100°. *
p
<
0.05,
**
p
<
0.01, ***
p
<
0.001.
A
B