


 34 / 78

CARDIOVASCULAR JOURNAL OF AFRICA • Volume 28, No 6, November/December 2017
372
AFRICA
Major abnormalities included:
•
arrhythmias (supraventricular as premature supraventricular
tachycardia, atrial flutter, atrial fibrillation, multifocal atrial
tachycardia, paroxysmal atrial tachycardia or ventricular-like
premature ventricular complex, ventricular fibrillation, accel-
erated idioventricular rhythm, Torsades de pointes)
•
major T-wave abnormalities (T-wave inversion)
•
left ventricular hypertrophy defined by the Cornell voltage
criteria [(S in V3
+
R in aVL
>
24 mm (men) or
>
20 mm
(women)]
•
pathological Q waves
•
prolonged QTc (
>
470 ms as calculated by Bazett’s formula)
•
left bundle branch block or other conduction delay
•
p-pulmonale defined as a P wave in lead II
>
2 mm or
>
1.5 mm in lead V1/V2.
Statistical analysis
All statistical analyses were performed with the Statistical
Package for the Social Sciences (SPSS) 20.0, Chicago, Illinois.
Prevalence, sensitivity (Se), specificity (Sp), and positive (PPV)
or negative predictive values (NPV) were calculated by the
following formulae:
16,17
Prevalence of an ECG abnormality
=
total with the
abnormality of interest/total number of patients in the group
of interest.
Considering echocardiography as our reference diagnostic
test in this study (PH present or not), we assessed the diagnostic
capability of ECG (ECG criteria positive or negative) in a 2
×
2
contingency table, and calculations were done using the above
equation, in which true (false) positive represented our patients
(PH group) with (without) ECG abnormalities, while true (false)
negative represented controls without (with) ECG abnormalities.
•
Se
=
[true positive/(true positive
+
false negative)]
×
100
•
Sp
=
[true negative/(true negative
+
false positive)]
×
100
•
PPV
=
[sensitivity
×
prevalence]
÷
[sensitivity
×
prevalence +
(1 – specificity)
×
(1 – prevalence)]
•
NPV
=
[specificity
×
(1 – prevalence)]
÷
[specificity
×
(1 –
prevalence) + (1 – sensitivity)
×
prevalence]
Prevalence, Se, Sp, PPV and NPV are presented as percentages,
while continuous variables are presented as means and standard
deviation (SD), or median (25th to 75th percentiles). We used
χ
²
to compare proportions of categorical variables and the Student’s
t
-test to compare mean differences for continuous variables. A
p
-value
<
0.05 was considered statistically significant.
Results
Fig. 2 shows how we obtained our cohort of 65 adult patients
with ECGs indicating PH from the overall 254 PAPUCO patients.
The patients were young (mean age 47
±
14 years), 21 (32%) were
men, and all except four were of black African origin. These
four patients were coloured or of mixed race. In Fig. 3, showing
a sample ECG, chest X-ray and echocardiographic images of a
45 patients did not fulfill inclusion
criteria:
• Newly diagnosed PH –
based on clinical and
echocardiographic criteria
• Able or likely to return for a
6-month follow up
• At least 18 years old
• Consented in writing to
participate in the registry
144 patients excluded because of:
• Missing ECG (118)
• Poor-quality ECG (17)
• Missing echocardiographic
diagnosis (9)
Patients admitted with PH
n
=
254
Patients enrolled in the study
n
=
209
ECGs analysed
n
=
65
Fig. 2.
Flow chart of inclusion for the study.
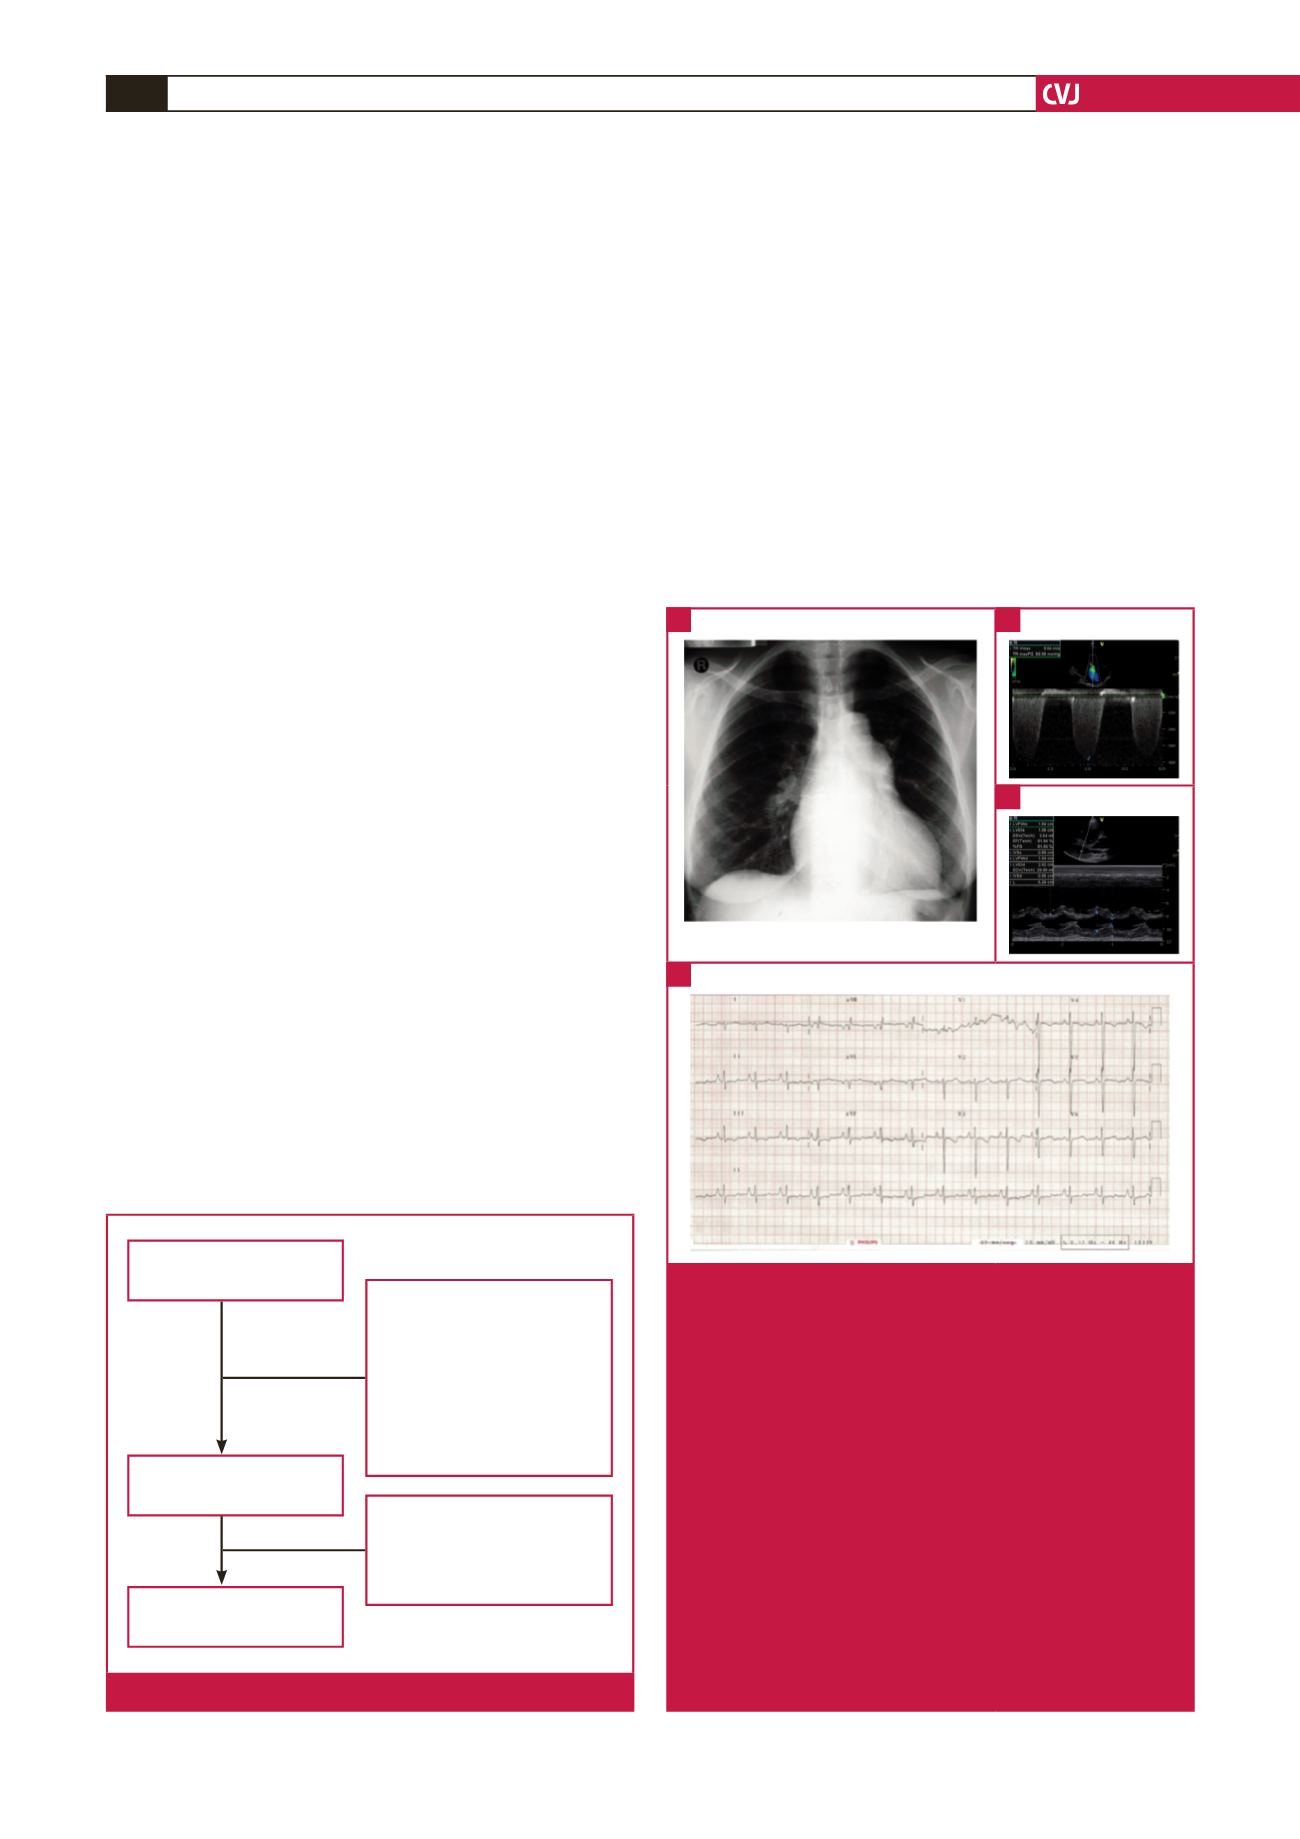
Fig. 3.
ECG of a 38-year-old HIV-positive woman from the
PAPUCO cohort. The patient had been on high-
ly active antiretroviral therapy for three years and
presented with palpitations and WHO functional class
stage III shortness of breath. The chest X-ray (A)
shows mild right heart enlargement and borderline
raised cardiothoracic ratio. Doppler echocardiographic
images (B, C) confirm the diagnosis of severe PH with
both severely enlarged right atrium and ventricle with
estimated RVSP of 63 mmHg. The ECG (D) shows
a normal heart rate and sinus rhythm, right heart
enlargement indicated by right-axis deviation of the
QRS complex and by a R/S ratio in lead V1 of
>
1
with poor R-wave progression. Right ventricular func-
tion was altered with a tricuspid annular plane systolic
excursion (TAPSE) of 9 mm. Left ventricular ejection
fraction was preserved, there was no valvular heart
disease and the pericardium was normal.
A
D
B
C