


 54 / 78

CARDIOVASCULAR JOURNAL OF AFRICA • Volume 28, No 6, November/December 2017
392
AFRICA
the MI group (Fig. 2E) had statistically significantly reduced
irisin immunoreactivity (
p
<
0.05). Relative to the MI group, MI
+
ILO (Fig. 2F), MI
+
SIL (Fig. 2G) and MI
+
ILO
+
SIL (Fig.
2H) all showed elevated irisin immunoreactivity, similar to that
of the control group.
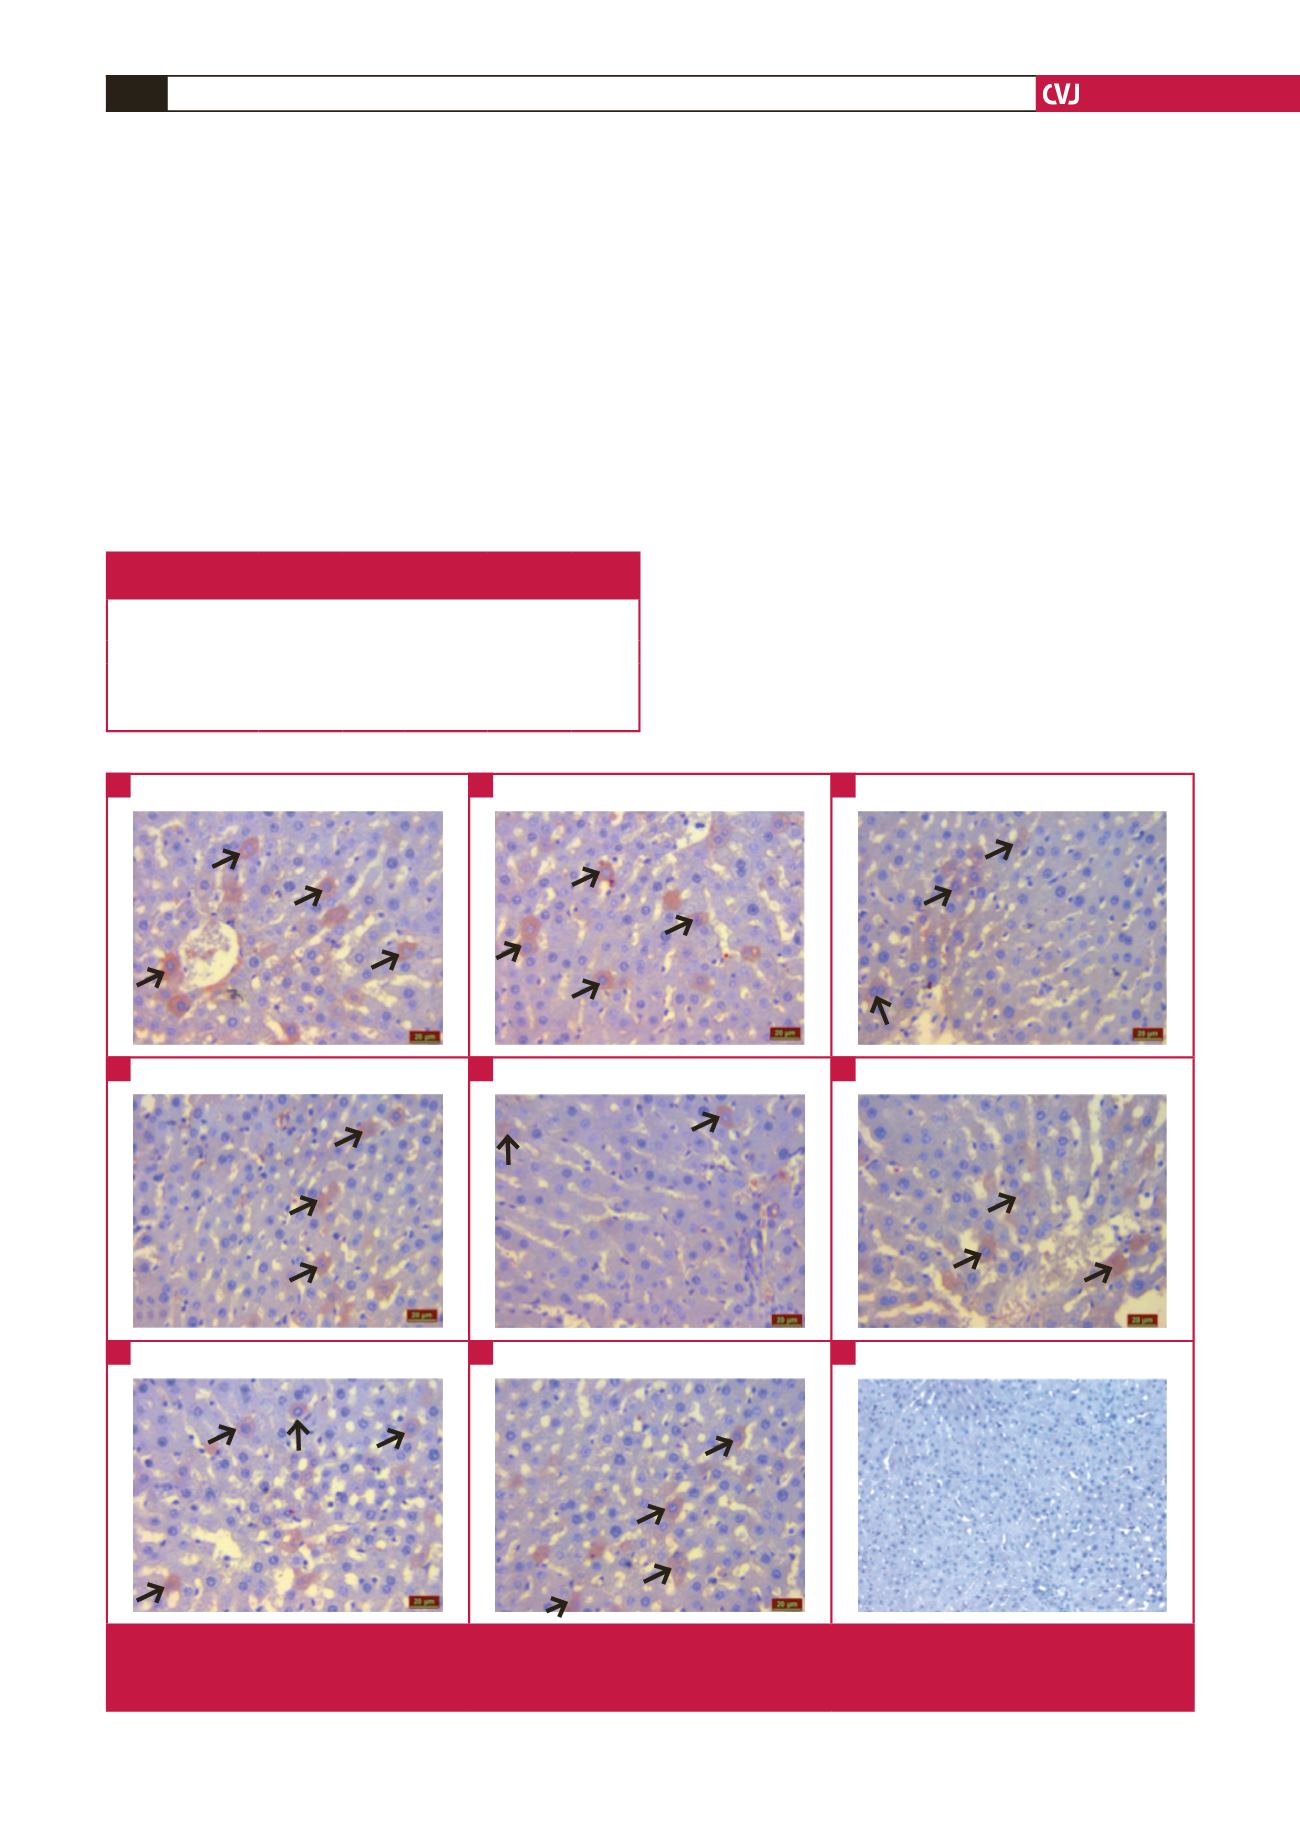
Irisin immunoreactivity (black arrow) was also observed
in the hepatocytes of the liver tissue in all groups. Irisin
immunoreactivity was similar in the control (Fig. 3A), ILO
(Fig. 3B), SIL (Fig. 3C) and ILO
+
SIL (Fig. 3D) groups.
However, relative to the control group, the MI group had
statistically significantly reduced irisin immunoreactivity (
p
<
0.05), while the MI
+
ILO (Fig. 3F), MI
+
SIL (Fig. 3G) and MI
+
ILO
+
SIL (Fig. 3H) groups had significantly increased irisin
immunoreactivity, similar to that in the control group.
Examination
under
the
light
microscope
of
immunohistochemical staining to detect irisin immunoreactivity
showed that the tubule cells in the renal cortex of the kidney
of all groups had irisin immunoreactivity (black arrow). Irisin
immunoreactivity was similar in the control (Fig 4A), ILO
(Fig. 4B), SIL (Fig. 4C) and ILO
+
SIL (Fig. 4D) groups. In
comparison with the control group, the MI (Fig. 4E) group had
a statistically significant decrease in irisin immunoreactivity
(
p
<
0.05). However, the MI
+
ILO (Fig. 4F), MI
+
SIL (Fig.
4G), MI
+
ILO
+
SIL (Fig. 4H) had a significantly higher irisin
immunoreactivity. Table 2 summarises the histological scores of
irisin immunoreactivity in all tissues and groups.
When serum irisin levels in the ischaemic group were
compared to those of the control group, they were found to be
significantly lower than the controls. However, the groups to
which ILO and SIL were administered, either individually or in
combination, had elevated serum irisin levels. Serum irisin levels
of the control group and the groups administered ILO and SIL
before MI induction were statistically similar.
Table 1. Histological scores in the heart tissue of rats
with induced cardiac ischaemia
Inflamma-
tory cells Congestion Fibrosis Oedema
Tissue
integrity Necrosis
Control
0 ± 00
0 ± 00 0 ± 00 0 ± 00
0 ± 00 0 ± 00
MI
2.33 ± 0.51
a
2.50 ± 0.83
a
0 ± 00 3.16 ± 0.40
a
2.83 ± 0.98
a
0 ± 00
MI: myocardial ischaemia–reperfusion;
a
In comparison with the control group,
p
<
0.05.
Fig. 3.
Irisin immunoreactivity after iloprost (ILO) and sildenafil (SIL) administration to hepatic tissues with cardiac ischaemia.
Control (A), ILO (B), SIL (C), ILO
+
SIL (D), MI
+
ILO (F), MI
+
SIL (G), MI
+
ILO
+
SIL (H) and negative control; no irisin
immunoreactivity (I).
A
D
G
B
E
H
C
F
I