


 55 / 78

CARDIOVASCULAR JOURNAL OF AFRICA • Volume 28, No 6, November/December 2017
AFRICA
393
Furthermore, CK, CKMB, troponin I and NO values
measured in the study increased with ischaemia. In addition to
the histological findings presented above, elevated CK, CKMB
and troponin I levels provided further confirmation of the
induction of ischaemia with left coronary artery ligation in this
animal experiment (Table 3).
A comparison of serum and heart tissue NO levels between
the ischaemic and control groups demonstrated that the
former had statistically significantly higher NO levels (Table
3). However, groups to which ILO and SIL were administered,
either individually or in combination after the induction of
ischaemia, had lower serum and heart tissue irisin levels. NO
levels in the serum and heart tissue of the control group and
groups administered ILO and SIL before MI induction were
statistically similar.
Table 2.The histological scores pertinent to irisin
immunoreactivity in all tissues and groups
Heart
Liver
Kidney
Control
0.83 ± 0.12
0.69 ± 0.15
0.72 ± 0.15
ILO
0.78 ± 0.09
0.82 ± 0.24
0.75 ± 0.17
SIL
0.74 ± 0.13
0.78 ± 0.18
0.76 ± 0.15
ILO
+
SIL
0.75 ± 0.12
0.61 ± 0.12
0.65 ± 0.15
MI
0.24 ± 0.05
a
0.28 ± 0.07
a
0.26 ± 0.05
a
MI
+
ILO
0.76 ± 0.15
b
0.77 ± 0.12
b
0.61 ± 0.17
b
MI
+
SIL
0.85 ± 0.05
b
0.68 ± 0.10
b
0.82 ± 0.13
b
MI
+
ILO
+
SIL
0.73 ± 0.15
b
0.70 ± 0.14
b
0.64 ± 0.08
b
a
In comparison with the control group,
b
in comparison with the MI group,
p
<
0.05.
Table 3. Changes in the levels of CK, CKMB, troponin I, NO
and irisin in serum of rats administered iloprost (ILO)
and sildenafil (SIL) for cardiac ischaemia
Groups
CK
(IU/l)
CKMB
(IU/l)
Troponin 1
(ng/ml)
NO
(
μ
mol)
Irisin
(ng/ml)
Control
6 ± 1 0.00 ± 0 0.01 ± 0 34 ± 7 16.1 ± 1.7
ILO
6.5 ± 1 0.02 ± 0 0.01 ± 0 41 ± 9 14.9 ± 2.9
SIL
6.9 ± 1 0.00 ± 0 0.00 ± 0 29 ± 6 15.8 ± 2.7
ILO
+
SIL
7.1 ± 2 0.00 ± 0 0.00 ± 0 31 ± 6 16.2 ± 08
MI
648 ± 146
a
118 ± 54 4.8 ± 9
a
135 ± 26 9 ± 2.6
a
MI
+
ILO
594 ± 116
b
82 ± 18
b
3.9 ± 8
b
96 ± 24 7.6 ± 2.6
b
MI
+
SIL
416 ± 119
b
64 ± 17
b
3.1 ± 8
b
62 ± 11 6.3 ± 2.4
MI
+
ILO
+
SIL 577 ± 133
b
77 ± 17
b
3.4 ± 9
b
69 ± 12 6.9 ± 2.6
b
a
In comparison with the control group,
b
in comparison with the MI group,
p
<
0.05
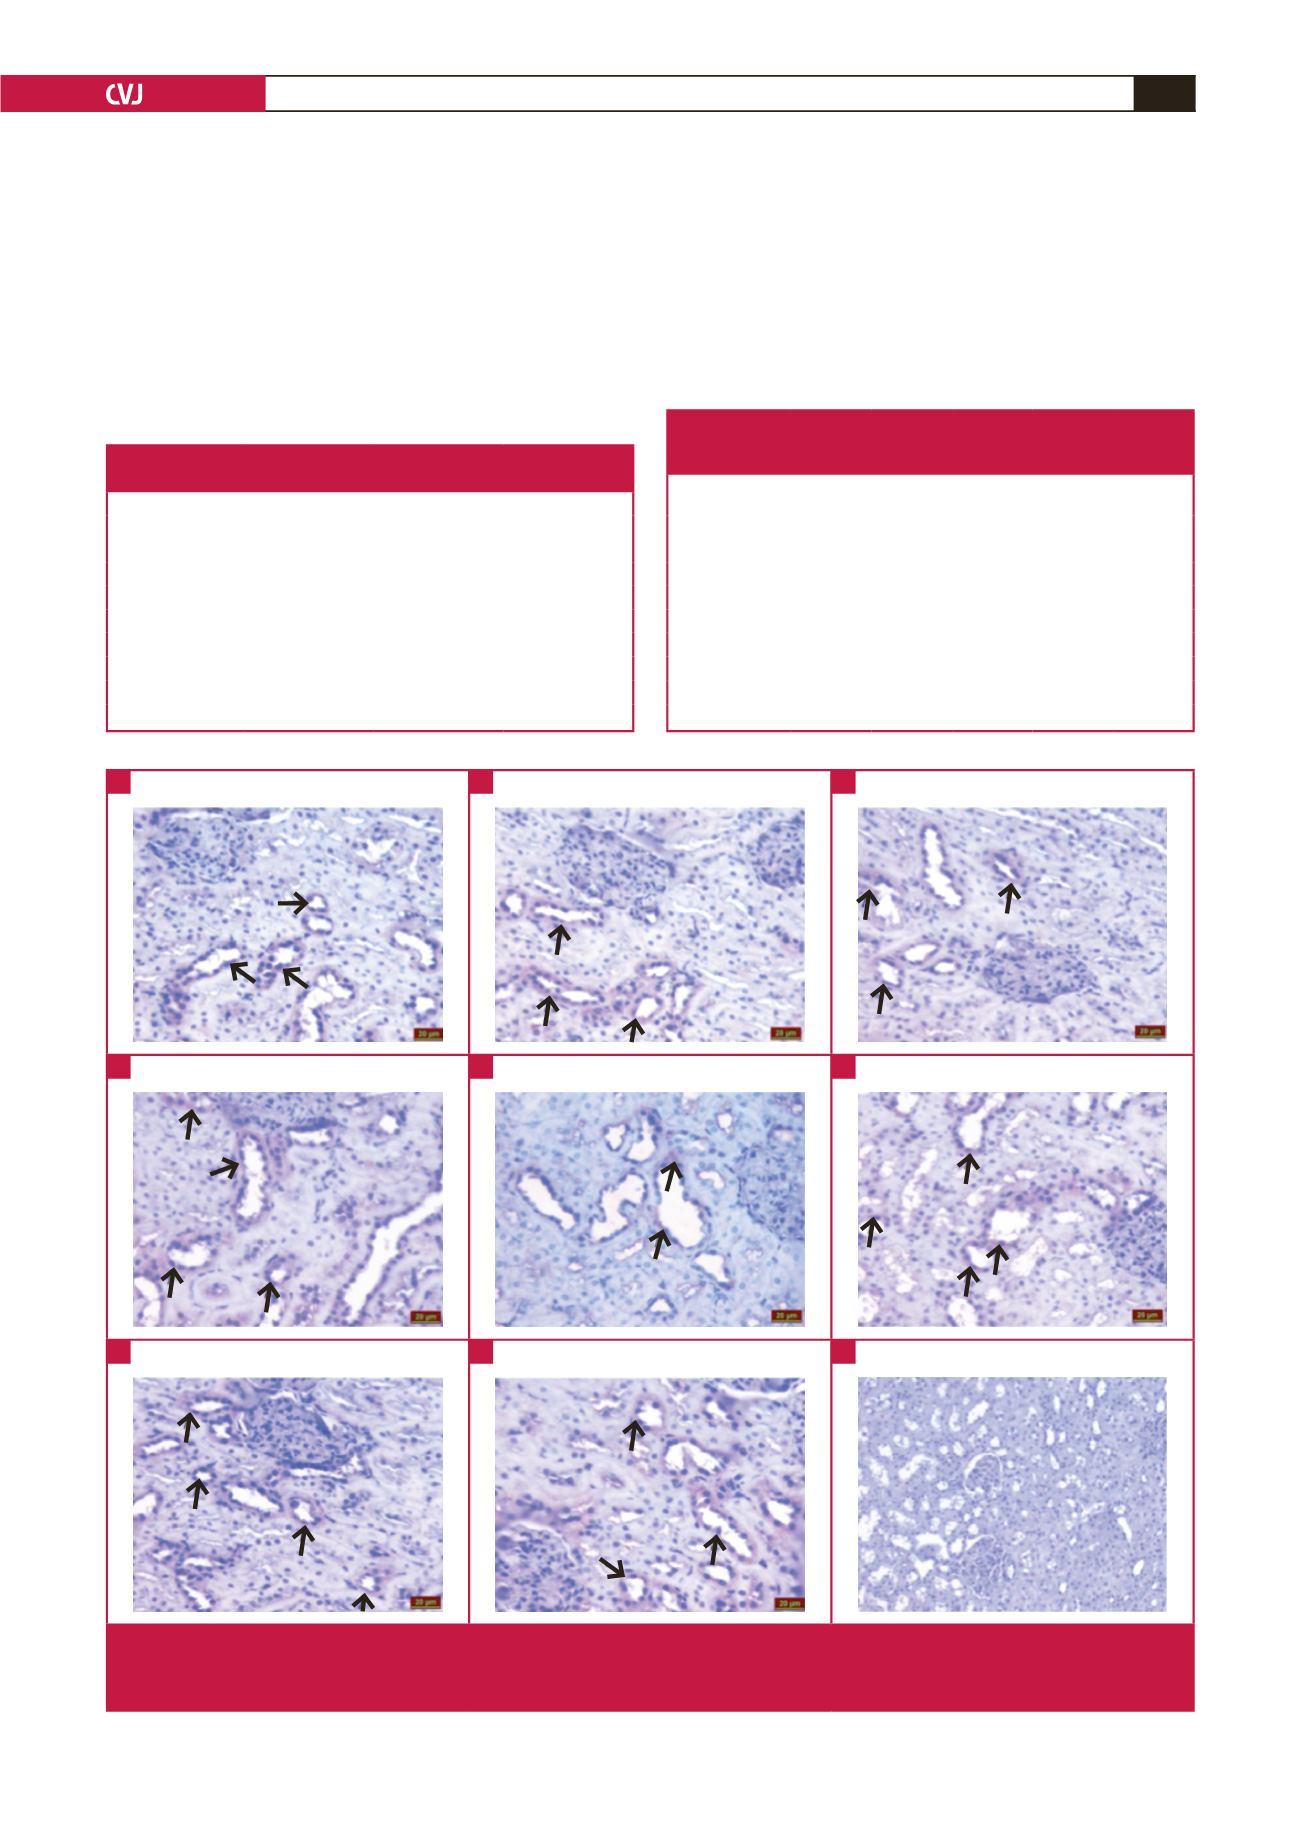
Fig. 4.
Irisin immunoreactivity after iloprost (ILO) and sildenafil (SIL) administration to renal tissues with cardiac ischaemia. Control
(A), ILO (B), SIL (C), ILO
+
SIL (D), MI
+
ILO (F), MI
+
SIL (G), MI
+
ILO
+
SIL (H) and negative control; no irisin immuno-
reactivity (I).
A
D
G
B
E
H
C
F
I