


 20 / 68

CARDIOVASCULAR JOURNAL OF AFRICA • Volume 30, No 3, May/June 2019
148
AFRICA
Supporting previous literature,
28
this study indicates that blood
pressure may not be a determinant of childhood underweight.
The study furthermore shows that hypertension prevalence
was higher among underweight children than in those not
underweight and it confirms a previous study.
29
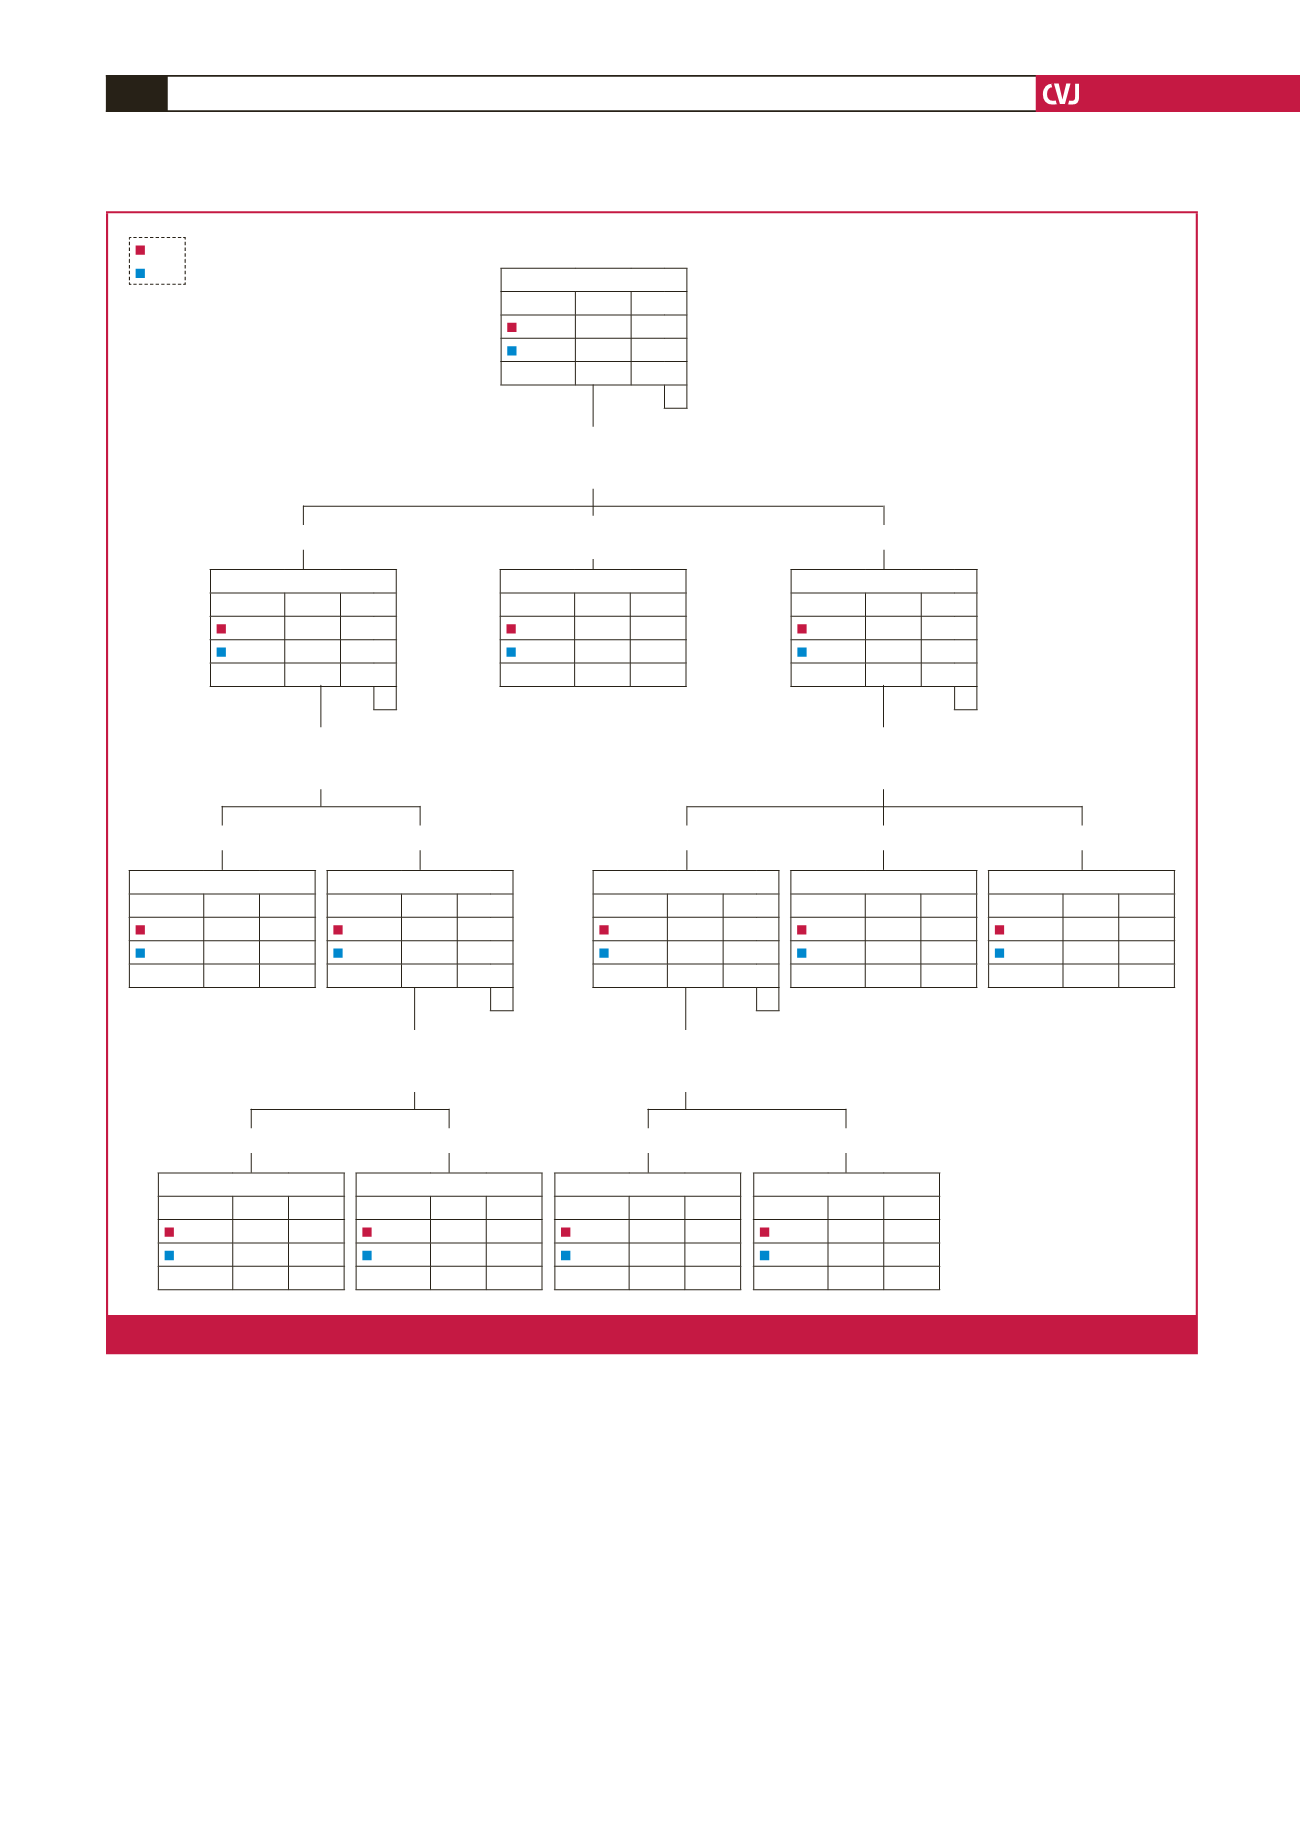
Factors predicting childhood underweight
Nutritional status: our study detected that nutrition was the first
predictor in the decision tree, indicating that it was the most
important risk factor for childhood underweight. Of the total
sample, moderate and severe undernutrition appeared to be the
most important, followed by mild undernutrition (92%) and
normal nutrition (54.8%). The high prevalence of undernutrition
among childhood underweight found by Black
et al
. corresponds
with the findings of our study.
30
Age: consistent with previous studies,
14,31
our analysis has
shown that age group was another important risk factor
for childhood underweight. The study detected that mild
undernutrition in children aged between five and 10 years was a
predictor of childhood underweight, which is in agreement with
a previous study conducted in a rural South African population.
31
The reason for this being a predictor may be that the abdominal
muscles weaken as an individual gets older, decreasing BMI.
Gender and educational level: replicating consistent research
results from rural black South African populations,
9,10,32
this study
Node 0
Category %
n
No
19.5 354
Yes
80.5 1457
Total
100.0 1811
–
Node 11
Category %
n
No
12.3 18
Yes
87.7 128
Total
8.1 146
Node 12
Category %
n
No
35.2 43
Yes
64.8 79
Total
6.7 122
Node 8
Category %
n
No
1.5
1
Yes
98.5 64
Total
3.6 65
Node 7
Category %
n
No
71.3 241
Yes
28.7 97
Total
18.7 338
Node 4
Category %
n
No
0.0
0
Yes
100.0 265
Total
14.6 265
Node 2
Category %
n
No
0.0
0
Yes
100.0 265
Total
14.6 265
Underweight
Node 6
Category %
n
No
22.8 61
Yes
77.2 207
Total
14.8 268
–
Node 3
Category %
n
No
45.2 303
Yes
54.8 368
Total
37.1 671
–
Node 1
Category %
n
No
7.9 50
Yes
92.
581
Total
34.8 631
–
Node 5
Category %
n
No
13.7 50
Yes
86.3 316
Total
20.2 366
–
No
Yes
Gender
Adj.
p
-value = 0.000;
Chi-square = 21.451; df = 1
Age group
Adj.
p
-value = 0.000;
Chi-square = 39.318; df = 1
Age group
Adj.
p
-value = 0.000;
Chi-square = 197.505; df = 2
School level
Adj.
p
-value = 0.000;
Chi-square = 19.855; df = 1
Node 9
Category %
n
No
23.8 35
Yes
76.2 112
Total
8.1 147
Node 10
Category %
n
No
6.8 15
Yes
93.2 204
Total
12.1 219
Male
Female
Primary
Preschool
11–13 years; 14–16 years
8–10 years; 5–7 years
11–13 years; 14–16 years
5–7 years
8–10 years
Severe undernutrition;
moderate undernutrition
Normal
Mild undernutrition
Nutrition
Adj.
p
-value = 0.000;
Chi-square = 455.231; df = 2
Fig. 1.
The CHAID decision tree analysis to identify the factors of childhood underweight in Ellisras.