


 25 / 68

CARDIOVASCULAR JOURNAL OF AFRICA • Volume 30, No 3, May/June 2019
AFRICA
153
Prior to PDA closure, the PAP was significantly higher in
group B than in group A (
p
<
0.05). The mean PAP in group B
was 47.6
±
8.1, and in group A it was 40.3
±
6.2 (Table 2). It was
higher in both groups than in the control group (23.2
±
5.1) (
p
<
0.05) (Tables 3, 4).
After PDA assessment, the PAP was enhanced significantly
in both groups (
p
<
0.05) and approached non-significance
compared with the control group at the six-month follow-up
assessment. The mean PAP in group A after the intervention was
23.9
±
4.9, and in group B it was 21.9
±
4.7 (Tables 3, 4).
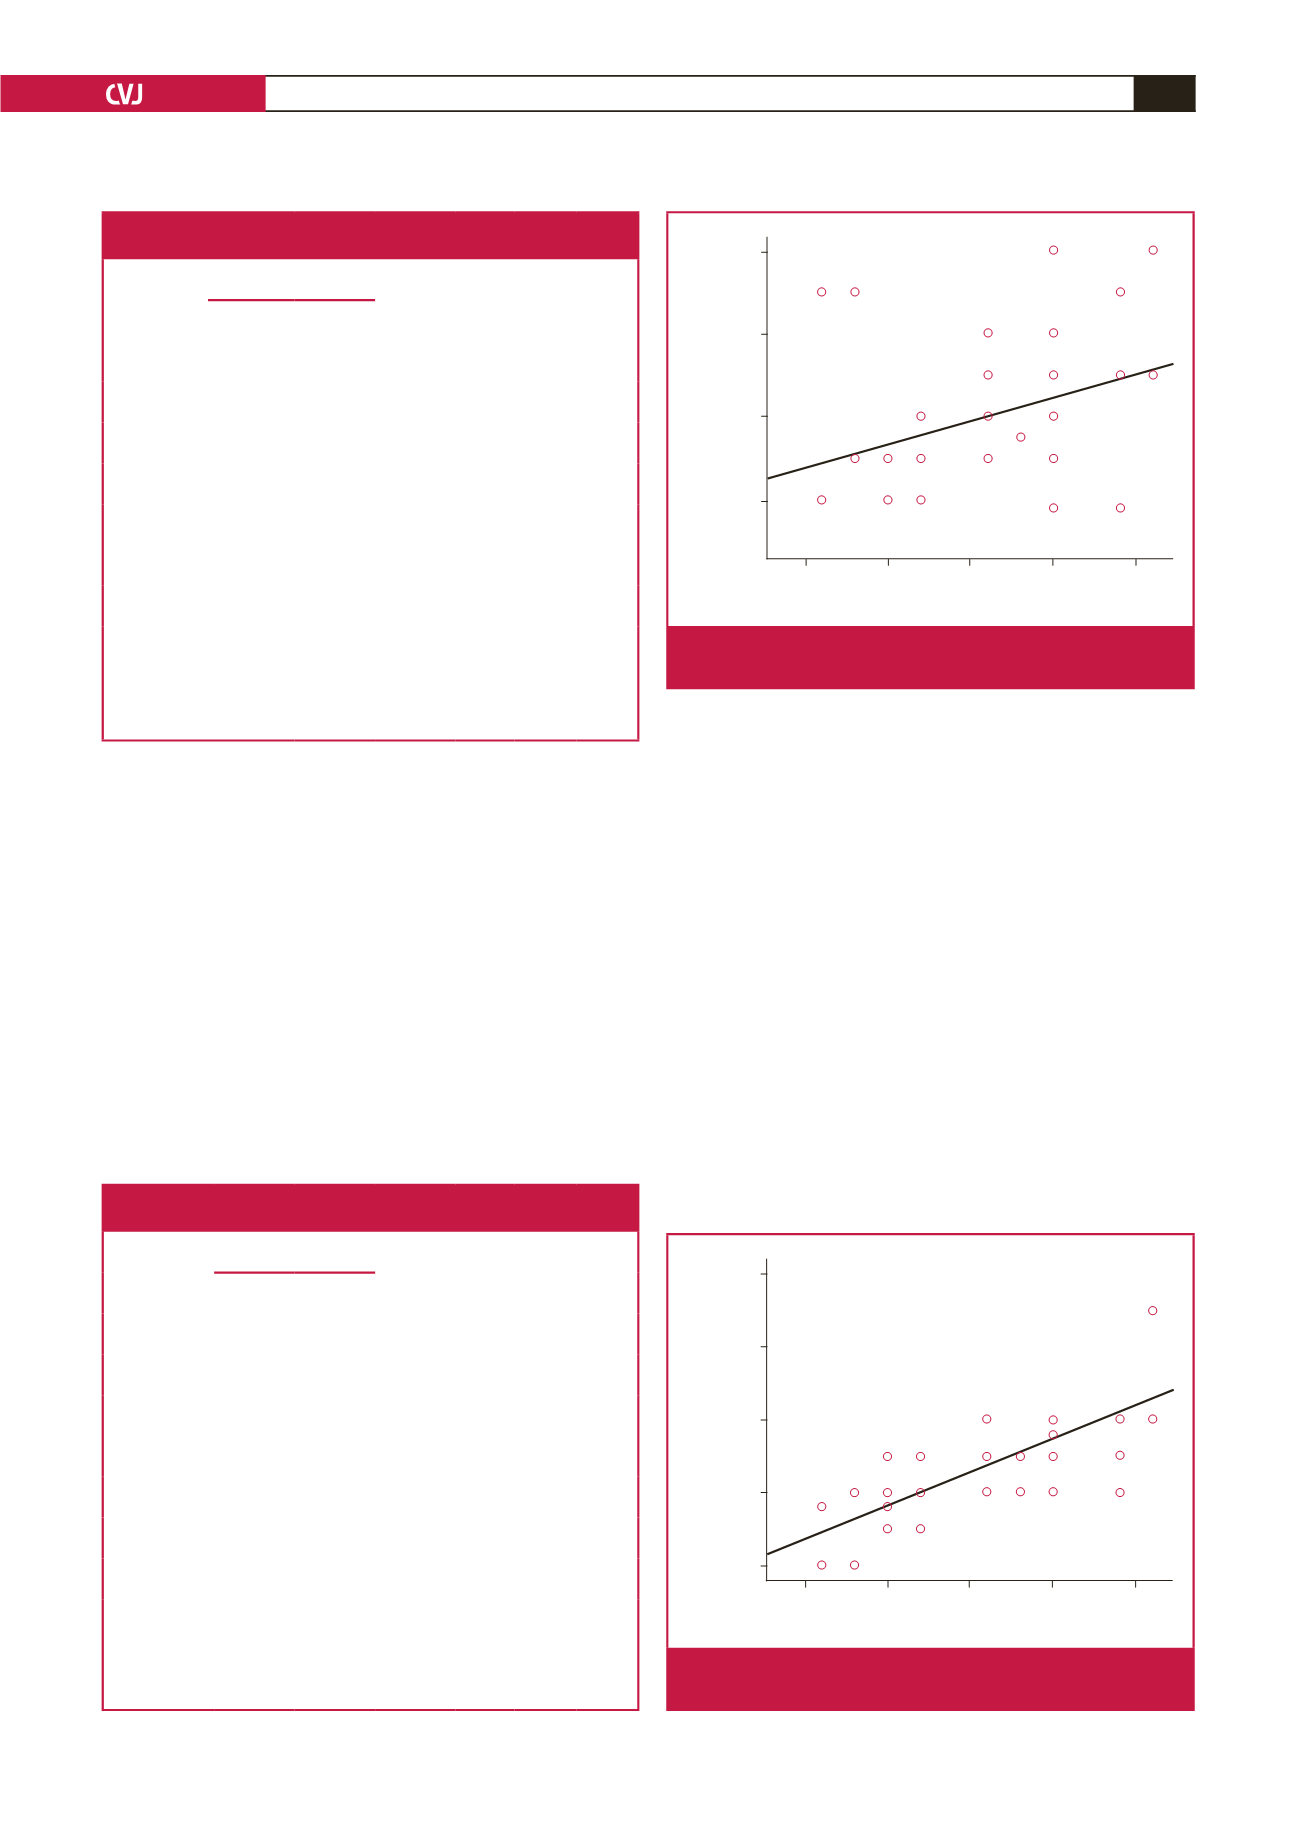
The ASI was positively correlated with the left ventricular
end-diastolic diameter (LVEDD) (
r
=
0.58,
p
<
0.05) (Fig. 1),
BNP level (
r
=
0.303,
p
<
0.05) (Fig. 2) and PAP (
r
=
0.68,
p
<
0.05). It was negatively correlated with LVEF (
r
=
0.66,
p
<
0.05)
(Fig. 3).
Discussion
PDA causes volume overload of the left side of the heart, which
can lead to pulmonary hypertension. The planning of treatment
for congenital heart deformities depends on the haemodynamic
and anatomical circumstances when considering myocardial cell
adjustment and chamber remodelling.
1
It is critical to have various techniques for observing patients
with PDA.
1
In our study we attempted to assess the impact
of postponement of PDA closure on aortic stiffness and its
connection with heart function prior to and after transcatheter
closure of PDA as a tool for observing patients with PDA.
Our study demonstrated that patients in group A had a
significantly higher ASI than those in the control group before
closure (
p
<
0.05). After closure, the ASI diminished significantly,
however it was significantly higher in group A than in the control
group at the six-month follow-up assessment (
p
<
0.05) (Table 3).
Patients with PDA in subgroup B had a significantly higher ASI
than the control group before closure (
p
<
0.05). After closure,
ASI
2.5
5.0
7.5
10.0
12.5
BNP
100
80
60
40
r
= 0.423
p
= 0.001**
Fig. 1.
A significant positive correlation is shown between the
ASI and BNP.
Table 3. Comparison between group A and the control group with regard
to ASI, BNP, PAP and cardiac function before and after PDA closure
Variables
Patients with PDA
(
n
=
30)
Control
group
(
n
=
30)
p
-value
p
-value
†
p
-value
‡
Before
closure
After
closure
ASI, mean
±
SD
6.7
±
2.8
3.8
±
1.4 1.6
±
0.74
<
0.05
<
0.05
<
0.05
LVEF (%)
mean
±
SD
59.4
±
5.3
66
±
4.2 66.7
±
3.4
<
0.05
<
0.05 0.6
LVEDD (mm)
mean
±
SD
3.4
±
0.85 3
±
0.82 2.8
±
0.55
<
0.05
<
0.05
<
0.05
LVESD (mm)
mean
±
SD
2.2
±
0.37 2.0
±
0.32 1.9
±
0.54
<
0.05
<
0.05
<
0.05
E/Ea, mean
±
SD
11.2
±
1.9
6.9
±
0.88 6.5
±
1.06
<
0.05
<
0.05
<
0.05
BNP, mean
±
SD
59.6
±
16.1 19.9
±
5.5 19.8
±
5.1
<
0.05
<
0.05 0.9
PAP, mean
±
SD
43.5
±
7.3 23
±
4.7 23.2
±
5.1
<
0.05
<
0.05 0.8
p
: significance between patients before and after closure;
p
†
: significance between
patients before closure and controls;
p
‡
: significance between patients after closure
and controls; ASI: arterial stiffness index; LVEF: left ventricular ejection fraction;
LVEDD: left ventricular end-diastolic diameter; LVESD: left ventricular end-
systolic diameter; E/Ea: ratio of early mitral flow velocity to early mitral annular
velocity; BNP: brain natriuretic peptide; PAP: pulmonary artery pressure.
Table 4. Comparison between group B and the control group with regard
to ASI, BNP, PAP and cardiac function before and after PDA closure
Variables
Patients with PDA
(
n
=
30)
Control
group
(
n
=
30)
p
-value
p
-value
†
p
-value
‡
Before
closure
After
closure
ASI, mean
±
SD
9.4
±
2.7 6.3
±
2.4 1.6
±
0.77
<
0.05
<
0.05
<
0.05
LVEF (%)
mean
±
SD
52.6
±
2.2 58
±
2.5 66.9
±
3.3
<
0.05
<
0.05
<
0.05
LVEDD (mm)
mean
±
SD
4.1
±
0.98 3.7
±
0.93 1.8
±
0.59
<
0.05
<
0.05
<
0.05
LVESD (mm)
mean
±
SD
3.4
±
0.85 3
±
0.82 2.8
±
0.55
<
0.05
<
0.05
<
0.05
E/Ea, mean
±
SD
10.9
±
1.5 7.0
±
0.85 6.2
±
1.1
<
0.05
<
0.05
<
0.05
BNP, mean
±
SD
70
±
14.7 20.2
±
6.3 19.4
±
4.0
<
0.05
<
0.05 0.5
PAP, mean
±
SD
47.6
±
8.1 21.9
±
4.7 23.4
±
5.0
<
0.05
<
0.05 0.2
p
: significance between patients before and after closure;
p
†
: significance between
patients before closure and controls;
p
‡
: significance between patients after closure
and controls; ASI: arterial stiffness index; LVEF: left ventricular ejection fraction;
LVEDD: left ventricular end-diastolic diameter; LVESD: left ventricular end-
systolic diameter; E/Ea: ratio of early mitral flow velocity to early mitral annular
velocity; BNP: brain natriuretic peptide; PAP: pulmonary artery pressure.
ASI
2.5
5.0
7.5
10.0
12.5
PAP
70
60
50
40
30
r
= 0.764
p
= 0.001**
Fig. 2.
A significant positive correlation is shown between the
ASI and PAP.