
CARDIOVASCULAR JOURNAL OF AFRICA • Volume 31, No 1, January/February 2020
52
AFRICA
distribution at the higher level (district), with a VPC of 3.8
and 2.1% for the null and the risk-factor-adjusted models,
respectively. After adjusting for the effect of risk factors, the
level-specific change in variance (Ds
2
) was equally important at
both the individual and district level.
This implies that the risk factors were unequally distributed
between individuals and between districts. This could possibly
be the reason for the difference in race-wise results between the
unadjusted and adjusted estimates. The unadjusted prevalence
showed that prevalence was highest inAsian/Caucasians, followed
by the mixed race, and lowest in Africans, while the adjusted
estimates showed lower chances of hypertension in Asians/
Caucasians. This most likely was due to the reduced confounding
effect of age, whose average was highest in Asians/Caucasians,
followed by the mixed race and lowest for Africans. A previous
study found age-standardised self-reported hypertension to be
highest in mixed-race women followed by African women.
39
There were important geographic variations in hypertension
prevalence between districts in South Africa, even after
controlling for socio-demographic and behavioural background
factors. Districts with a lower-than-average prevalence were
mostly in the north-eastern part of the country (Limpopo,
Mpumalanga and Gauteng provinces) while those with a higher-
than-average prevalence were mostly found in the Western,
Eastern and Northern Cape provinces. Most of these districts
are coastal districts in close vicinity to the Atlantic Ocean. A
previous study that limited geographic variation of hypertension
to the provincial level found similar clustering of hypertension
prevalence.
22
Identifying districts (sub-units) with high and low
hypertension prevalence could be useful in programming
public health interventions. Districts with a high hypertension
burden could be considered for targeted prevention and control
programmes, rather than one national intervention programme.
As governments, especially in LMICs, are faced with multiple
needs and limited resources, their role of ensuring that all people
have equitable access to preventative, curative and rehabilitative
health services involves preventing them from developing
hypertension and its complications.
40-42
Our study has shown
that, although the majority of South African districts had
approximately the same burden of hypertension, some had
a heavier burden than others, even after accounting for risk
factors documented to have a strong influence on hypertension
prevalence.
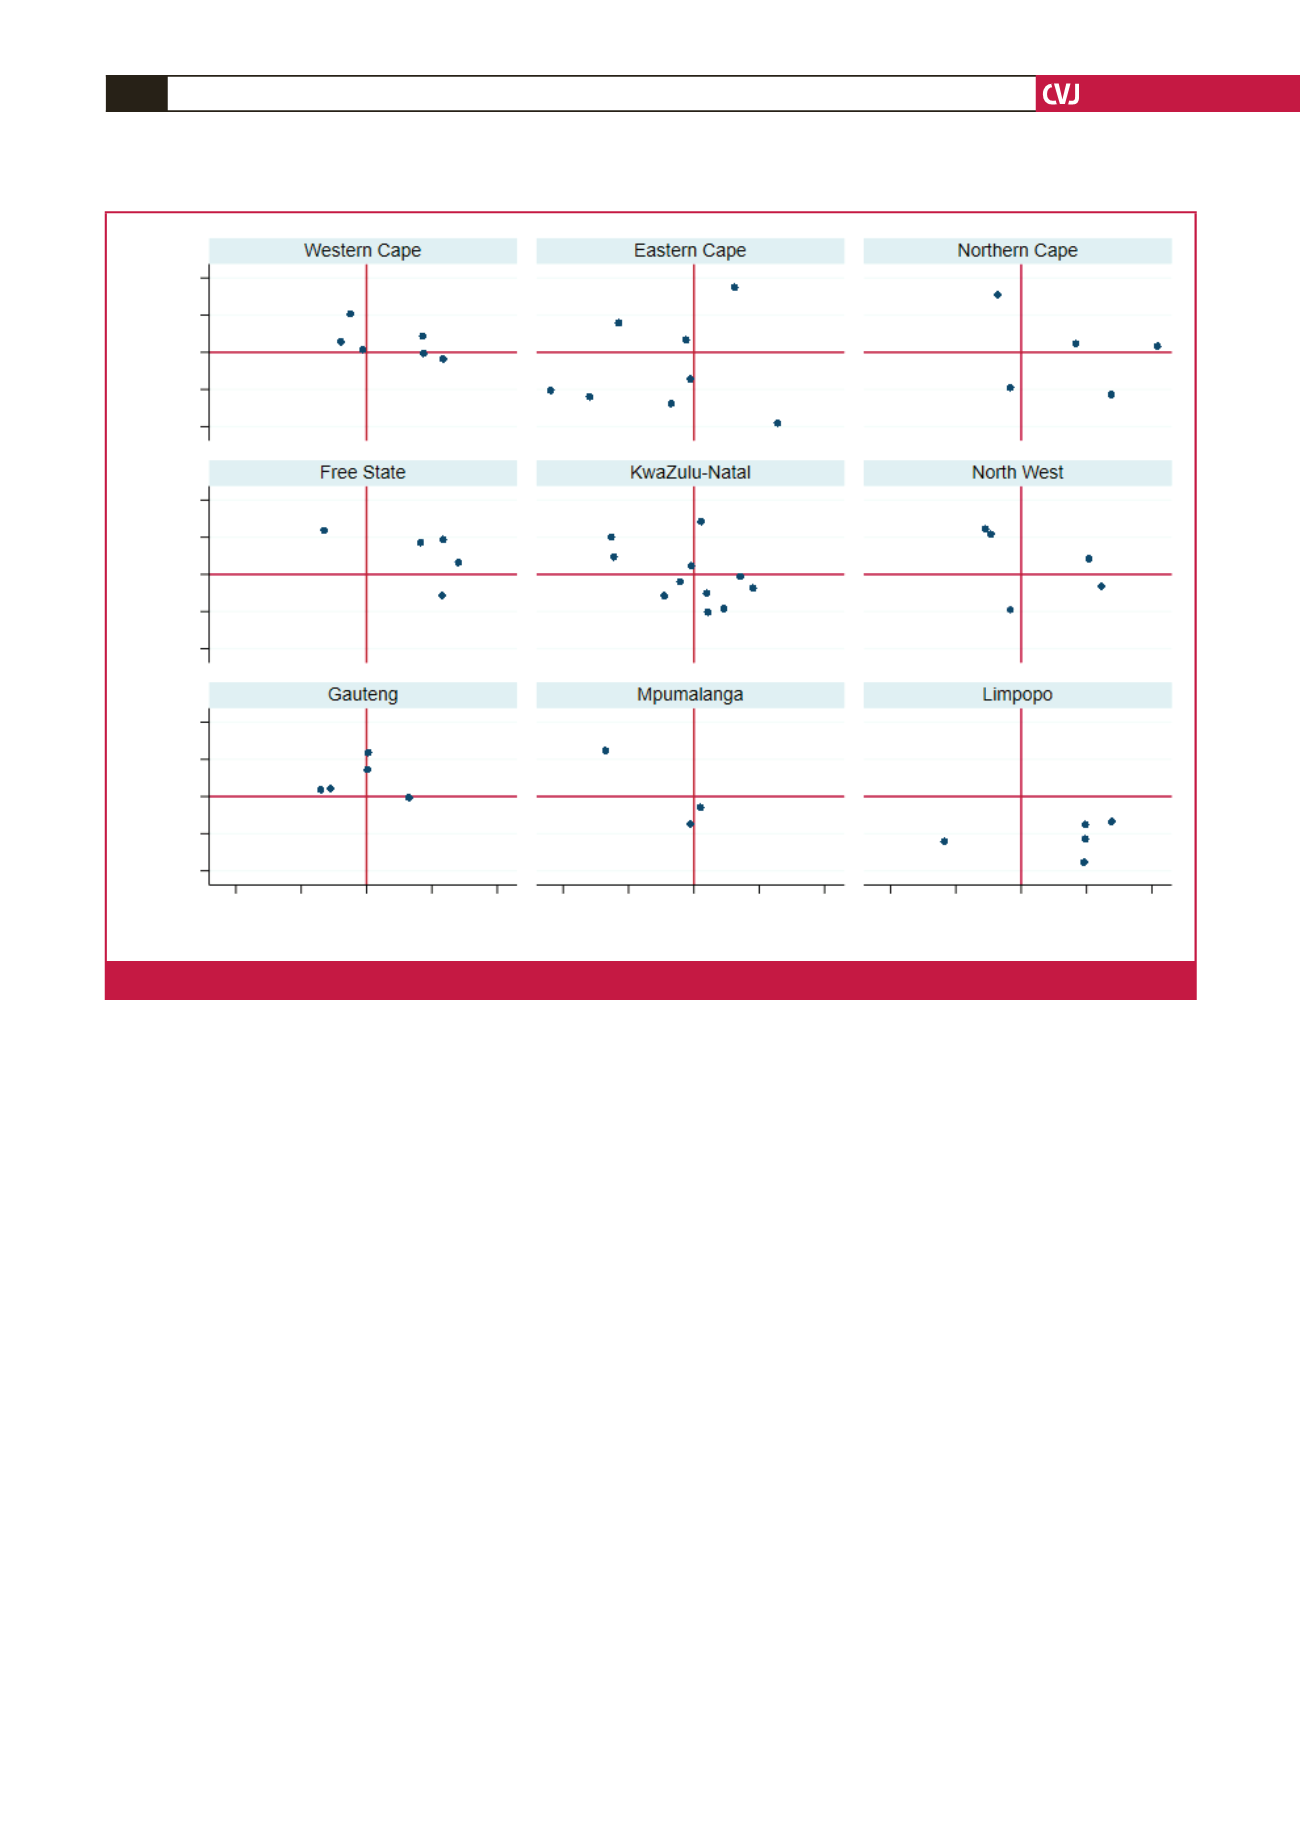
The effects of age and BMI on hypertension prevalence were
found to vary from district to district, showing their slopes were
higher in some districts relative to others. Health services that
address the risks of hypertension, for example body mass, should
target such areas.
Strengths and limitations
To the best of our knowledge this is the only study to have
estimated the prevalence of hypertension at the district level,
Random slopes: BMI (district)
0.02
0.01
0
–0.01
–0.02
0.02
0.01
0
–0.01
–0.02
0.02
0.01
0
–0.01
–0.02
Random slope: age (district)
0.02 0.04 0.06 0.08
0.1 0.02 0.04 0.06 0.08
0.1 0.02 0.04 0.06 0.08
0.1
Fig. 3.
Scatter plot for districts’ random slopes for age and BMI.


