


 53 / 62

CARDIOVASCULAR JOURNAL OF AFRICA • Volume 31, No 1, January/February 2020
AFRICA
51
of the variance for both the unadjusted and adjusted models
was at the individual level. The VPC shows the proportion of
hypertension prevalence variation at the district level to be 3.5%.
When adjusting for the explanatory variables, about 1.9% (3.5–
1.6) of the variance in the higher level (district) is explained by
the geographic distribution of demographic, behavioural, socio-
economic and environmental factors (Table 4). Level 1 variance
(within individuals’ observation) is the fixed value 3.29 (
π
2
/3),
which is the value assigned for a multilevel logistic regression.
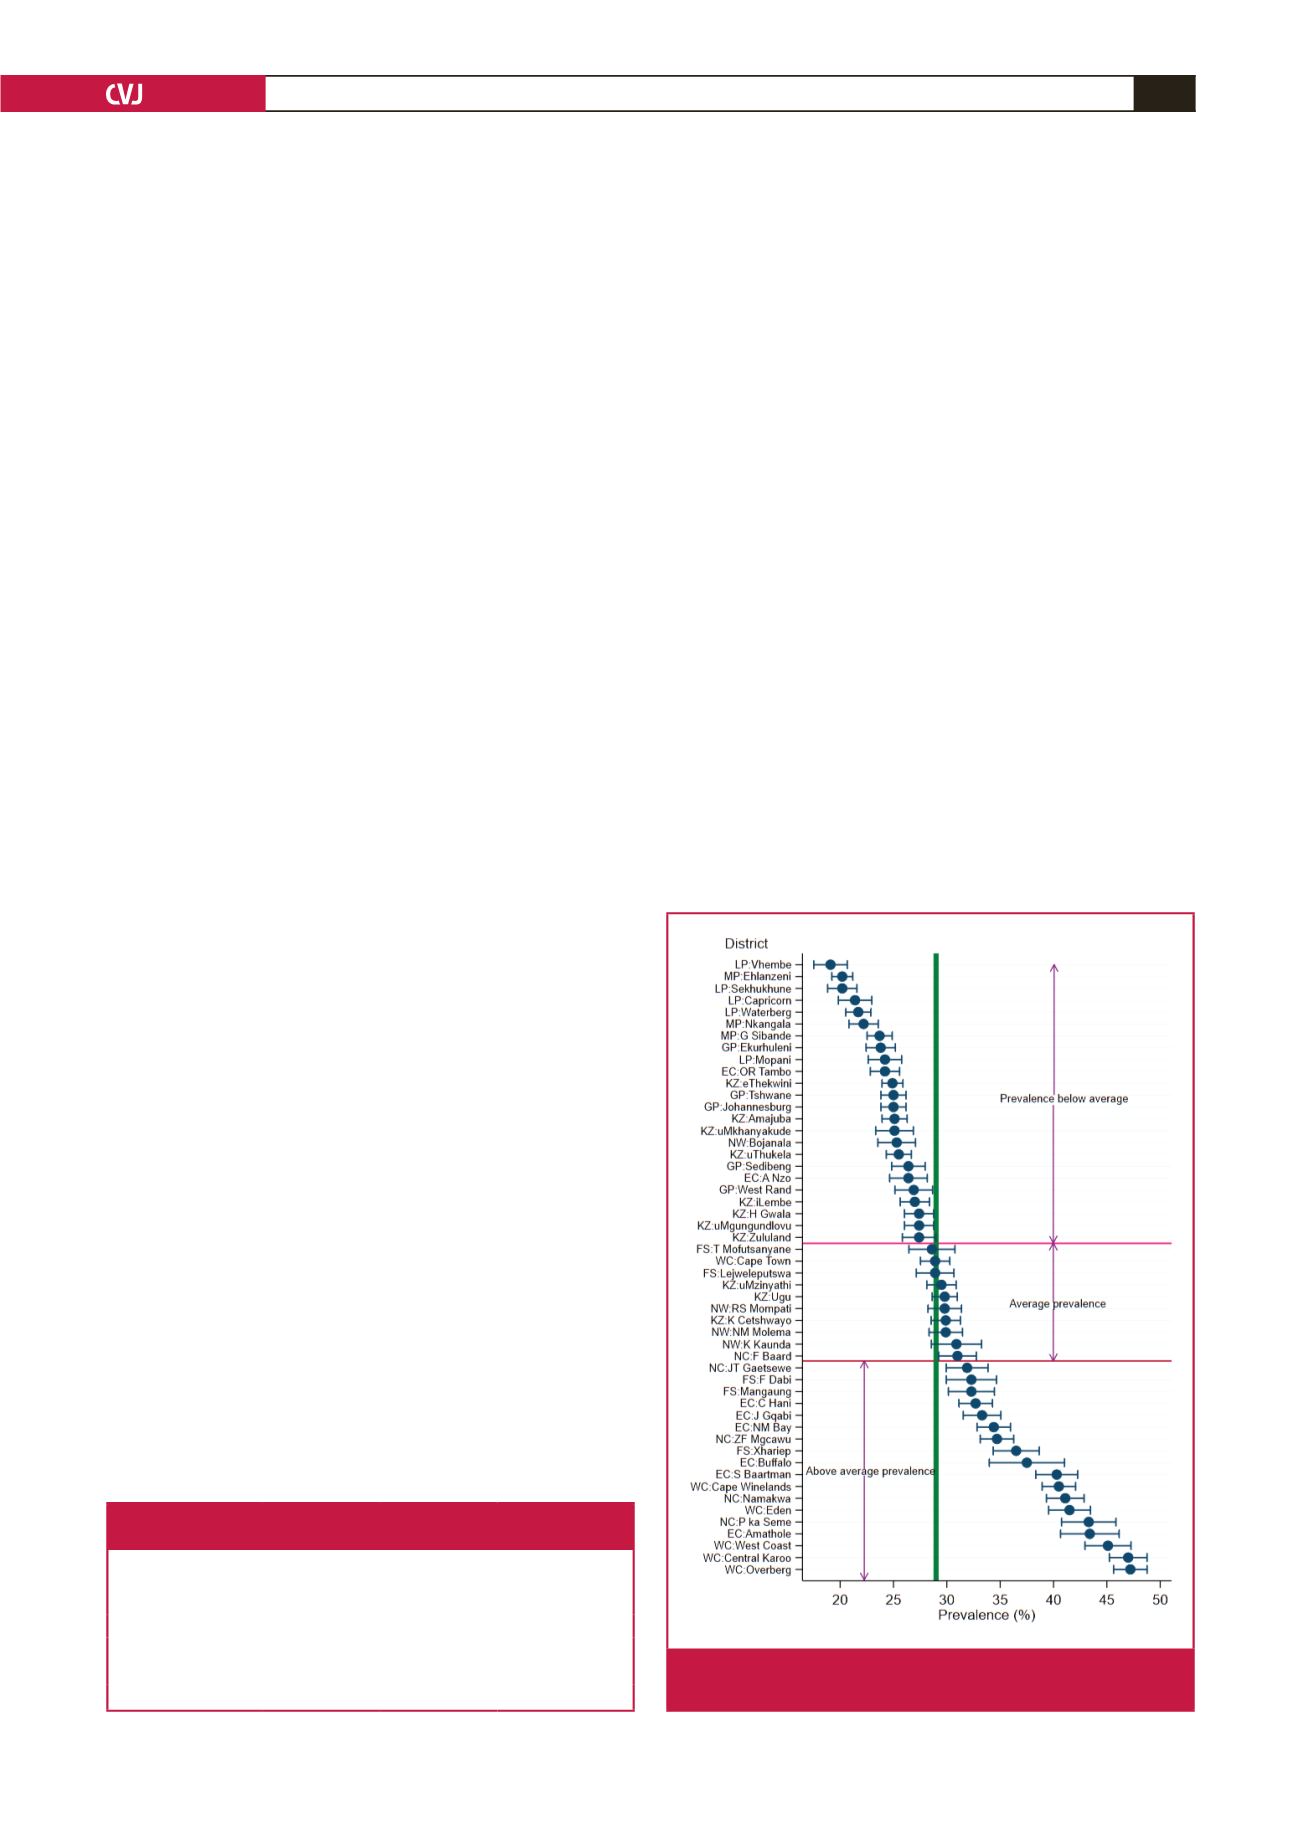
Adjusted prevalence at the district level
: the risk-factor adjusted
prevalence estimates, unlike the unadjusted (weighted) prevalence,
had narrower confidence intervals, and only about 10 districts had
a prevalence approximately equal to the average prevalence. A
common scenario under both estimation methods was that most
of the districts with a lower-than-average prevalence were found
in the northern and north-eastern part of the country, while those
with a higher-than-average prevalence were mostly in the south
and south-western parts of the country (the ‘Cape’ provinces).
All the districts in the Western Cape, except Cape Town, and
all the provinces in Northern Cape except Frances Baard had
prevalences above average. All districts in Limpopo, Mpumalanga
and Gauteng had prevalences below average (Fig 2).
Random district slopes for age and BMI
: the effect of age for
some districts was lower (districts whose slopes were below
the red horizontal line in Fig. 3) than its overall effect. These
districts included all from the Limpopo Province, and most of
those in Kwa-Zulu Natal and Eastern Cape. The effect of BMI
was relatively stronger in most of the districts in Limpopo, Free
State, Northern Cape and Kwa-Zulu Natal, and least for most
districts in the Eastern Cape.
Discussion
The purpose of this study was to analyse the degree of
hypertension prevalence variation for adults aged 15 years and
above at the district level before and after adjusting for risk
factors associated with hypertension. According to the results
of the multilevel model, factors that explained variation in
hypertension status in this study were found to be consistent in
certain aspects with previous research. For example, age and BMI
were the two strongest factors affecting hypertension prevalence
in this study, which is in agreement with other studies.
22-26
The effect of gender on hypertension has been conflicting,
with some studies showing a weak association, with females
having a lower prevalence of hypertension than males,
25-27
while
other studies have showed no association.
23,24,28
The results of the
multivariate analysis in this study showed that females had a
lower hypertension prevalence compared with males.
Alcohol use (past or current) has also been found to increase
the risk of hypertension in some studies,
24,29,30
while in another
study no relationship was found.
25
Smoking status, education,
and employment status have also yielded conflicting results from
various studies.
23,25
The mixed race and Africans were found in the multilevel
logistic regression to have increased prevalence of hypertension
compared with Asians/Caucasians. This is consistent with a
study done in the United States of America where there are such
mixed races.
31
Univariate analysis showed that prevalence of hypertension
for those who had subscription to a medical aid provider was
higher compared to those without medical aid, but multivariate
analysis showed no association. This is possibly because its
confounding effect was reduced by income level and education.
The percentage of those subscribed to a medical aid cover
increased with higher income and educational level.
The study also found seasonal effects with the odds of
increased hypertension prevalence being higher in the winter
months compared with summer. This is consistent with other
studies that have shown cold ambient temperatures to be
associated with elevated blood pressure,
32-35
and therefore the
effect has also been found to be larger in winter than in
summer.
36-38
Analyses of variance at the individual and district level
showed differences in the hypertension prevalence variance
Table 4. Variance partition and specific-level change in variance
between the null and the adjusted model
Variance component
Null model:
variance (SE)
Adjusted model:
variance (SE)
Change in
variance (%)(Ds
2
)
Individual
8.47 (0.224)
3.32 (0.0963)
–60.8
District
0.430 (0.082)
0.110 (0.026)
–74.4
Individual VPC (%)
69.4
49.4
Geographic VPC (%)
3.5
1.6
VPC: variance partition coefficient.
Fig. 2.
Mean difference in hypertension prevalence and 95%
CI for South African districts (adjusted model).