


 11 / 60

CARDIOVASCULAR JOURNAL OF AFRICA • Volume 32, No 1, January/February 2021
AFRICA
9
perfusion risk marker
18
was measured by instilling a local
anaesthetic drop (Novasine Wander 0.4% Novartis) in the
right eye to measure intra-ocular pressure (IOP) (Tono-Pen
Avia Applanation Tonometer; Reichert 7-0908, ISO 9001, New
York, USA). Diastolic ocular perfusion pressure (DOPP) was
calculated prior to FLIP: [diastolic blood pressure (DBP)–IOP
mmHg]. Hypertensive/diabetic retinopathy was diagnosed by a
registered ophthalmologist.
For SAM sampling, overnight eight-hour urine sampling was
performed at baseline with 24-hour sampling at follow up. The
sampling periods of eight and 24 hours compare favourably for
detection of norepinephrine in urine.
29
At the three-year follow
up, participants began and ended sampling with an empty
bladder on day one and commenced with a 24-hour standardised
dinner. Urine was collected for the next 24 hours in a three-litre
container, washed with 9 ml of 20% HCl (UriSet24, Sarstedt
®
,
Nümbrecht, Germany). Urine samples were stored at –80°C
until analysis, which occurred within one year from collection.
The 3-Cat Urine ELISA Fast Track kits (SKU: BA E-6600,
LDN, Nordhorn, Germany) were used where a standard range
of 0.5–1 000 ng/ml was reported. Mean levels of norepinephrine
42 ng/ml (standard error ± 4.4) at baseline with 49 ng/ml
(standard error ± 4.6) at follow up were apparent in the SABPA
cohort,
25
with intra- and inter-assay variability of 2.7 and 8.6%,
respectively. Urine creatinine was measured using the enzymatic
method (COBAS Integra 400 Plus, Roche, Basel, Switzerland)
where a standard range of 6–14 mmol/l was reported. Salivary
cortisol and
α
-amylase concentrations were determined using
commercial luminescence immunoassay kits (LIA) (IBL,
Hamburg Germany) and inter-assay (< 5%) and intra-assay (<
4%) variability was reported.
For HPA sampling, fasting blood samples were obtained
before 09:00 in both phases after the subjects had been awake
for 90 minutes and in a semi-recumbent position.
25
Samples were
handled according to standardised procedures and stored at
–80°C until analysis. Serum cortisol and ACTH were analysed
with an electrochemiluminescence immunoassay (e411, Roche,
Basel, Switzerland). Normal ranges for ACTH are between 10
and 60 pg/ml.
For confounder biochemical analyses,
serum high-density
lipoprotein cholesterol (HDL-C), an ischaemic stroke risk
marker,
30-33
was analysed with an enzyme-rated method (Unicel
DXC 800 – Beckman and Coulter, Germany). HDL-C ≥ 1.17
mmol/l is acceptable for normal HDL-C functioning, whereas
≤ 1.04 mmol/l reflects an increased risk for cardiovascular
disease.
31
Serum high-sensitivity C-reactive protein (CRP), serum
gamma glutamyl transferase (
γ
-GT) and whole-blood EDTA
glycated haemoglobin (HbA
1c
) were analysed with turbidimetric
inhibition immunoassays (Cobas Integra 400 Plus, Roche, Basel,
Switzerland). Serum cotinine was analysed with a homogeneous
immunoassay (Modular Roche automised systems, Basel,
Switzerland). Intra- and inter-assay coefficients for all analyses
were less than 10%.
Statistical analysis
Statistica version 13.3 (TIBCO Software Inc, Palo Alto, USA,
2018) was used for data analyses. Three-way ANCOVAs
independent of
a priori
covariates were computed to determine
main effect interactions (race × gender × u-NE median/tertiles/
quartiles/quintiles) for stroke
4,18,26
and neuronal hyperactivity
risk markers.
25-27
Retinal risk covariates were selected
a priori
u-NE tertile 1 (
n
= 93)
u-NE tertile 2 (
n
= 91)
u-NE tertile 3 (
n
= 91)
140
120
100
80
60
40
20
0
–20
–40
–60
**
**
**
*
*
∆3yr u-NE (%)
∆3yr ACTH (%)
∆3yr cortisol (%)
50
40
30
20
10
0
–10
–20
Pre-FLIP
α
-amylase
(U/ml)
*
*
∆FLIP
α
-amylase
(U/ml)
∆FLIP
α
-amylase
(%)
Pre-FLIP
cortisol
(nmol/l)
∆FLIP
cortisol
(nmol/l)
∆FLIP
cortisol
(%)
u-NE tertile 1 (
n
= 93)
u-NE tertile 2 (
n
= 91)
u-NE tertile 3 (
n
= 91)
300
250
200
150
100
50
0
*
Diastolic ocular
perfusion pressure
(mmHg)
Arteriolar calibre
(MU)
Venular calibre
(MU)
*
u-NE tertile 1 (
n
= 93)
u-NE tertile 2 (
n
= 91)
u-NE tertile 3 (
n
= 91)
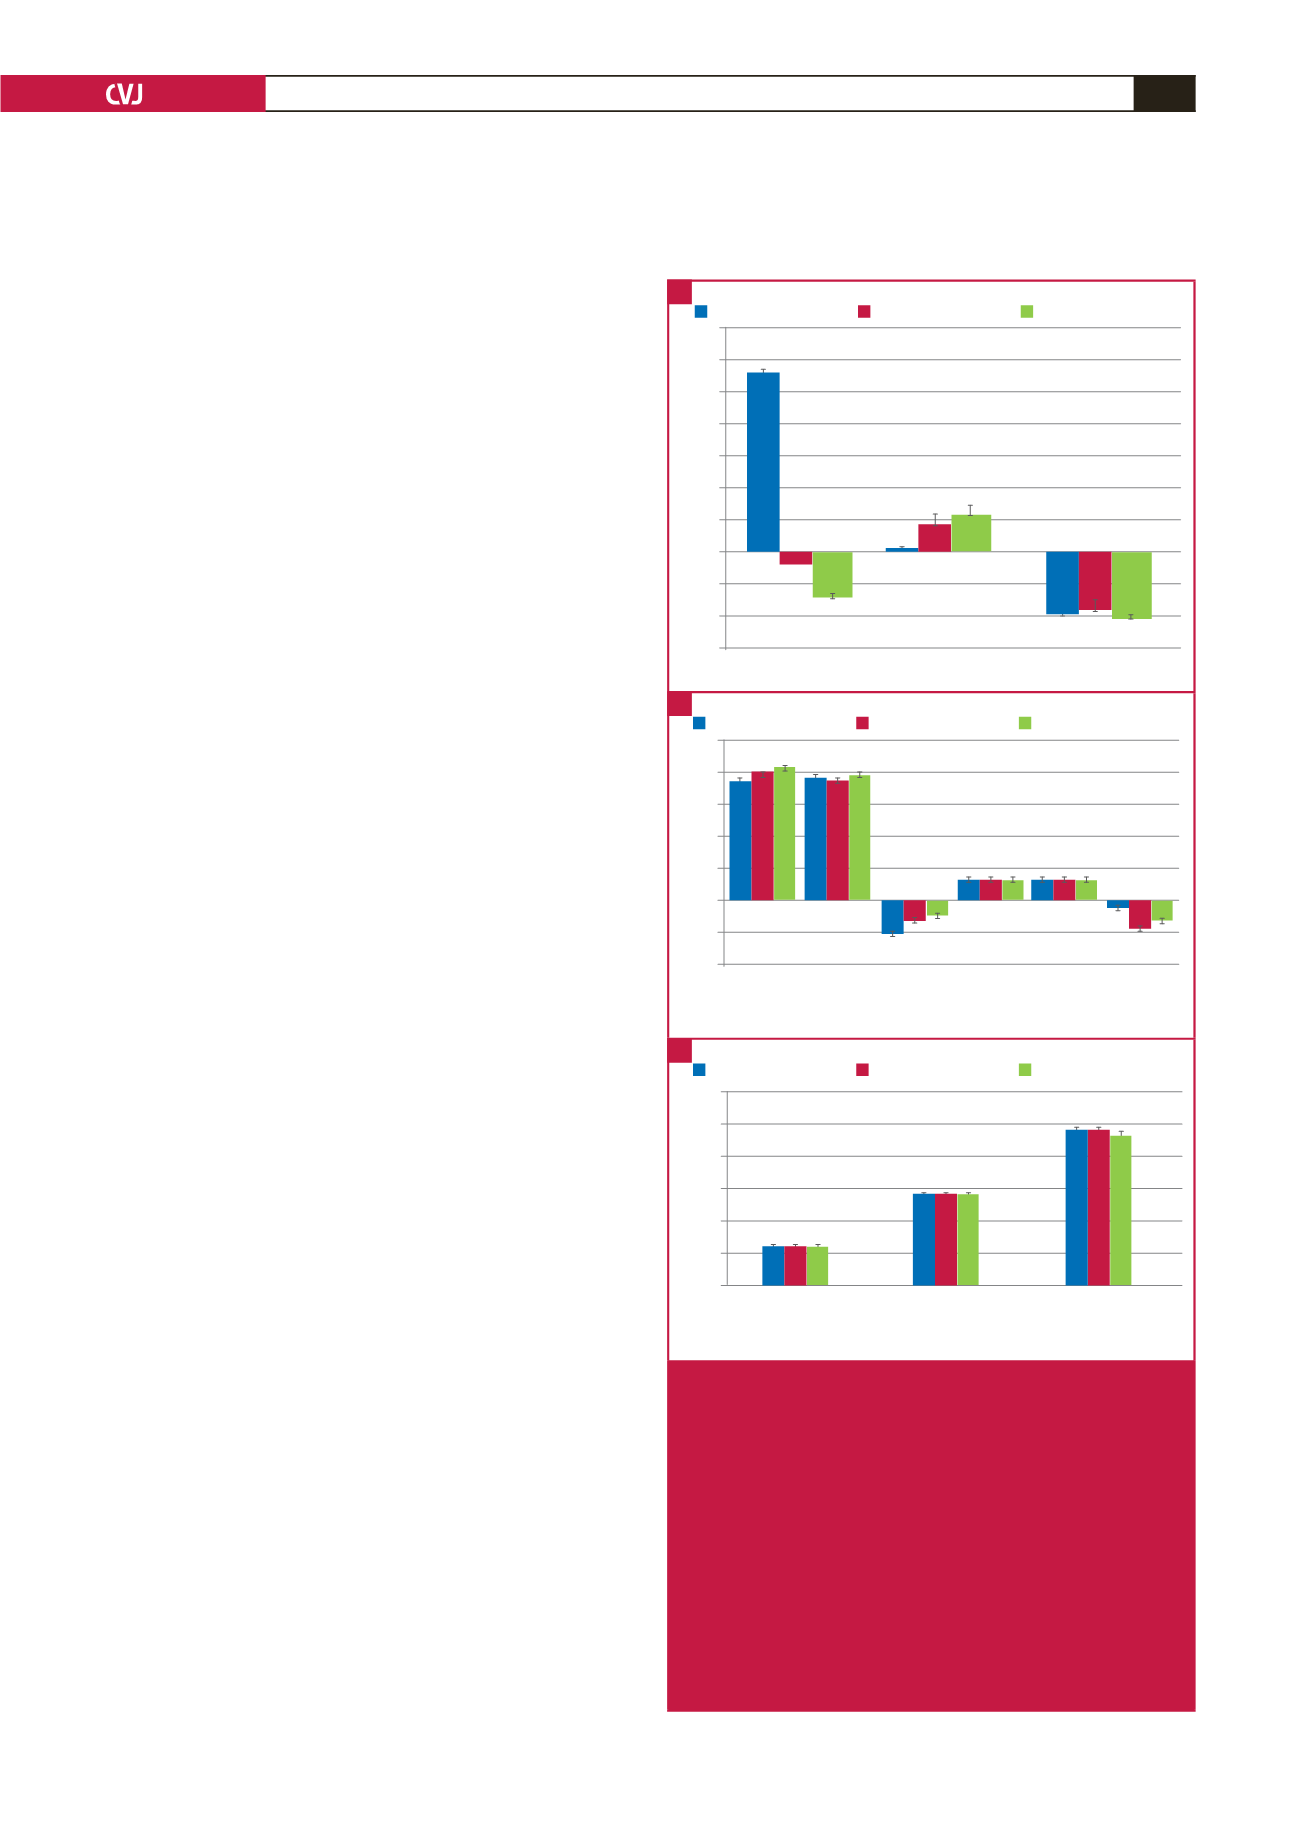
Fig. 2.
Comparing stress hormones and retinal vessel risk
markers. Data presented as median values across
increasing u-NE tertiles (nmol/l:mmol/l) [u-NE tertile
1, median (min–max): 8.74 (1.05–14.77); u-NE tertile
2, median (min–max): 21.23 (15.05–28.62); u-NE
tertile 3, median (min–max): 40.62 (28.69–113.63)].
A. Stress hormone three-year changes, with sali-
vary stress hormone changes (B) prior to and upon
flicker light-induced provocation (FLIP). C. Retinal
vessel risk markers. Significance is shown using
p
-values of non-parametric Kruskal–Wallis tests.
u-NE, norepinephrine:creatinine ratio; ∆3yr, three-
year changes; ACTH, adrenocorticotrophic hormone.
*
p
≤ 0.05; **
p
≤ 0.001.
A
B
C