


 13 / 60

CARDIOVASCULAR JOURNAL OF AFRICA • Volume 32, No 1, January/February 2021
AFRICA
11
respective median (min–max) u-NE concentrations were: u-NE
tertile 1 median (min–max): 8.74 nmol/l:mmol/l (1.05–14.77);
u-NE tertile 2 median (min–max): 21.23 nmol/l:mmol/l (15.05–
28.62); u-NE tertile 3 median (min–max): 40.62 nmol/l:mmol/l
(28.69–113.63). Normality was tested and skewed data were log
10
normalised.
The clinical characteristic proportions of the cohort were
determined at baseline using chi-squared (
χ
²) statistics. Stress
risk-marker changes were computed with dependent sample
t-
tests. Kruskal–Wallis tests determined significance, followed by
multiple comparisons tests and non-parametric Mann–Whitney
U
-tests when comparing retinal and stress hormone median
values.
Multiple linear regression analyses determined associations
between the retinal vasculature and the stress hormones in each
of the u-NE tertiles. Retinal vessel responses upon provocation
(FLIP)
included four dependent variable models: artery maximal
dilation (%), artery time to constrict (s), vein maximal dilation
(%) and vein post-FLIP recovery to baseline value (%). The
Table 5. Forward stepwise regression analyses depicting associations
between retinal vessel and stress hormone responses prior to and post
flicker light-induced provocation (FLIP) in norepinephrine:creatinine
(u-NE nmol/l:mmol/l) tertile 1
u-NE tertile 1 median (min–max):
8.74 (1.05–14.77) (n = 93)
Artery
max
dilation (%)
Artery time
max
constriction
(s)
Vein
max
dilation (%)
Vein
post-FLIP
recovery to
baseline (%)
∆3yr stress hormones (%)
Adjusted
R
2
0.16
β
(95% CI)
0.15
β
(95% CI)
0.20
β
(95% CI)
< 0.10
β
(95% CI)
u-NE (%)
–0.20
(–0.4, –0.0),
p
= 0.055
–
–
–
Serum cortisol (%)
–
–
–
–
Stress hormone levels prior to FLIP
Adjusted
R
2
< 0.10
β
(95% CI)
0.14
β
(95% CI)
< 0.10
β
(95% CI)
< 0.10
β
(95% CI)
Saliva
α
-amylase
(U/ml)
–0.25
(–0.5, 0.0),
p
= 0.029
–
–
–
∆FLIP stress hormones (%)
Adjusted
R
2
< 0.10
β
(95% CI)
0.15
β
(95% CI)
0.22
β
(95% CI)
0.15
β
(95% CI)
Saliva
α
-amylase (%)
–
NS
–
–
Saliva cortisol (%)
–
NS
–0.34
(–0.6, –0.1),
p
= 0.003
–0.25,
(–0.5, 0.0),
p
= 0.028
Baseline HDL-C
(mmol/l)
–
–
0.26
(0.0, 0.1),
p
= 0.022
–0.33
(–0.6, –0.1),
p
= 0.004
∆3yr; three-year stress hormone changes (%); Prior to FLIP, saliva stress hormone
levels prior to flicker light-induced provocation/FLIP; ∆FLIP, stress hormone
changes (%) obtained directly after FLIP. ∆, changes; NS; non-significant,
HDL-C; high-density lipoprotein cholesterol.
Additional covariates included age, waist circumference, cotinine smoking status,
log-normalised gamma-glutamyl transferase and glycated haemoglobin; hyperten-
sive/diabetic retinopathy and diastolic ocular perfusion pressure.
Table 6. Logistic regression analysis to predict the probability
of chronic stress-related stroke risk in a cohort with low urinary
norepinephrine:creatinine (u-NE nmol/l:mmol/l) (
n
= 90)
Chronic stress-related stroke risk
Nagelkerke R
2
0.62
Odds
ratio
5th
percentile
95th
percentile p-value
DOPP (mmHg)
1.07
0.99
1.17
0.104
FLIP HRV (ms)
1.52
0.42
1.05
0.078
FLIP cortisol (%)
1.08
0.74
1.58
0.705
FLIP delayed venous recovery
(% of baseline)
4.82
1.18
19.59
0.028
Covariates included high-density lipoprotein cholesterol and hypertensive/
diabetic retinopathy. DOPP, diastolic ocular perfusion pressure; FLIP HRV,
time-domain heart-rate variability standard deviation of the normal-to-normal
(NN) intervals between adjacent QRS complexes, which equal the square-root
of variance.
0 10 20 30 40 50 60 70 80 90 100 110 120
104
103
102
101
100
90
Relative vessel diameter in % to baseline
ARTERY
Baseline
Faster constriction:
u-NE tertiles 1 vs 3
p
< 0.05
FLIP
(12.5 Hz; 20 s)
u-NE tertile 1 (
n
= 93)
u-NE tertile 2 (
n
= 91)
u-NE tertile 3 (
n
= 91)
Time (s)
0 10 20 30 40 50 60 70 80 90 100 110 120
104
103
102
101
100
90
Relative vessel diameter in % to baseline
VEIN
Baseline
Post-FLIP recovery
u-NE tertiles 1 vs 3:
p
< 0.05
FLIP
(12.5 Hz; 20 s)
u-NE tertile 1 (
n
= 93)
u-NE tertile 2 (
n
= 91)
u-NE tertile 3 (
n
= 91)
Max. dilation:
u-NE tertiles 2 vs. 3: p <0.05
Time (s)
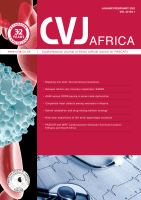
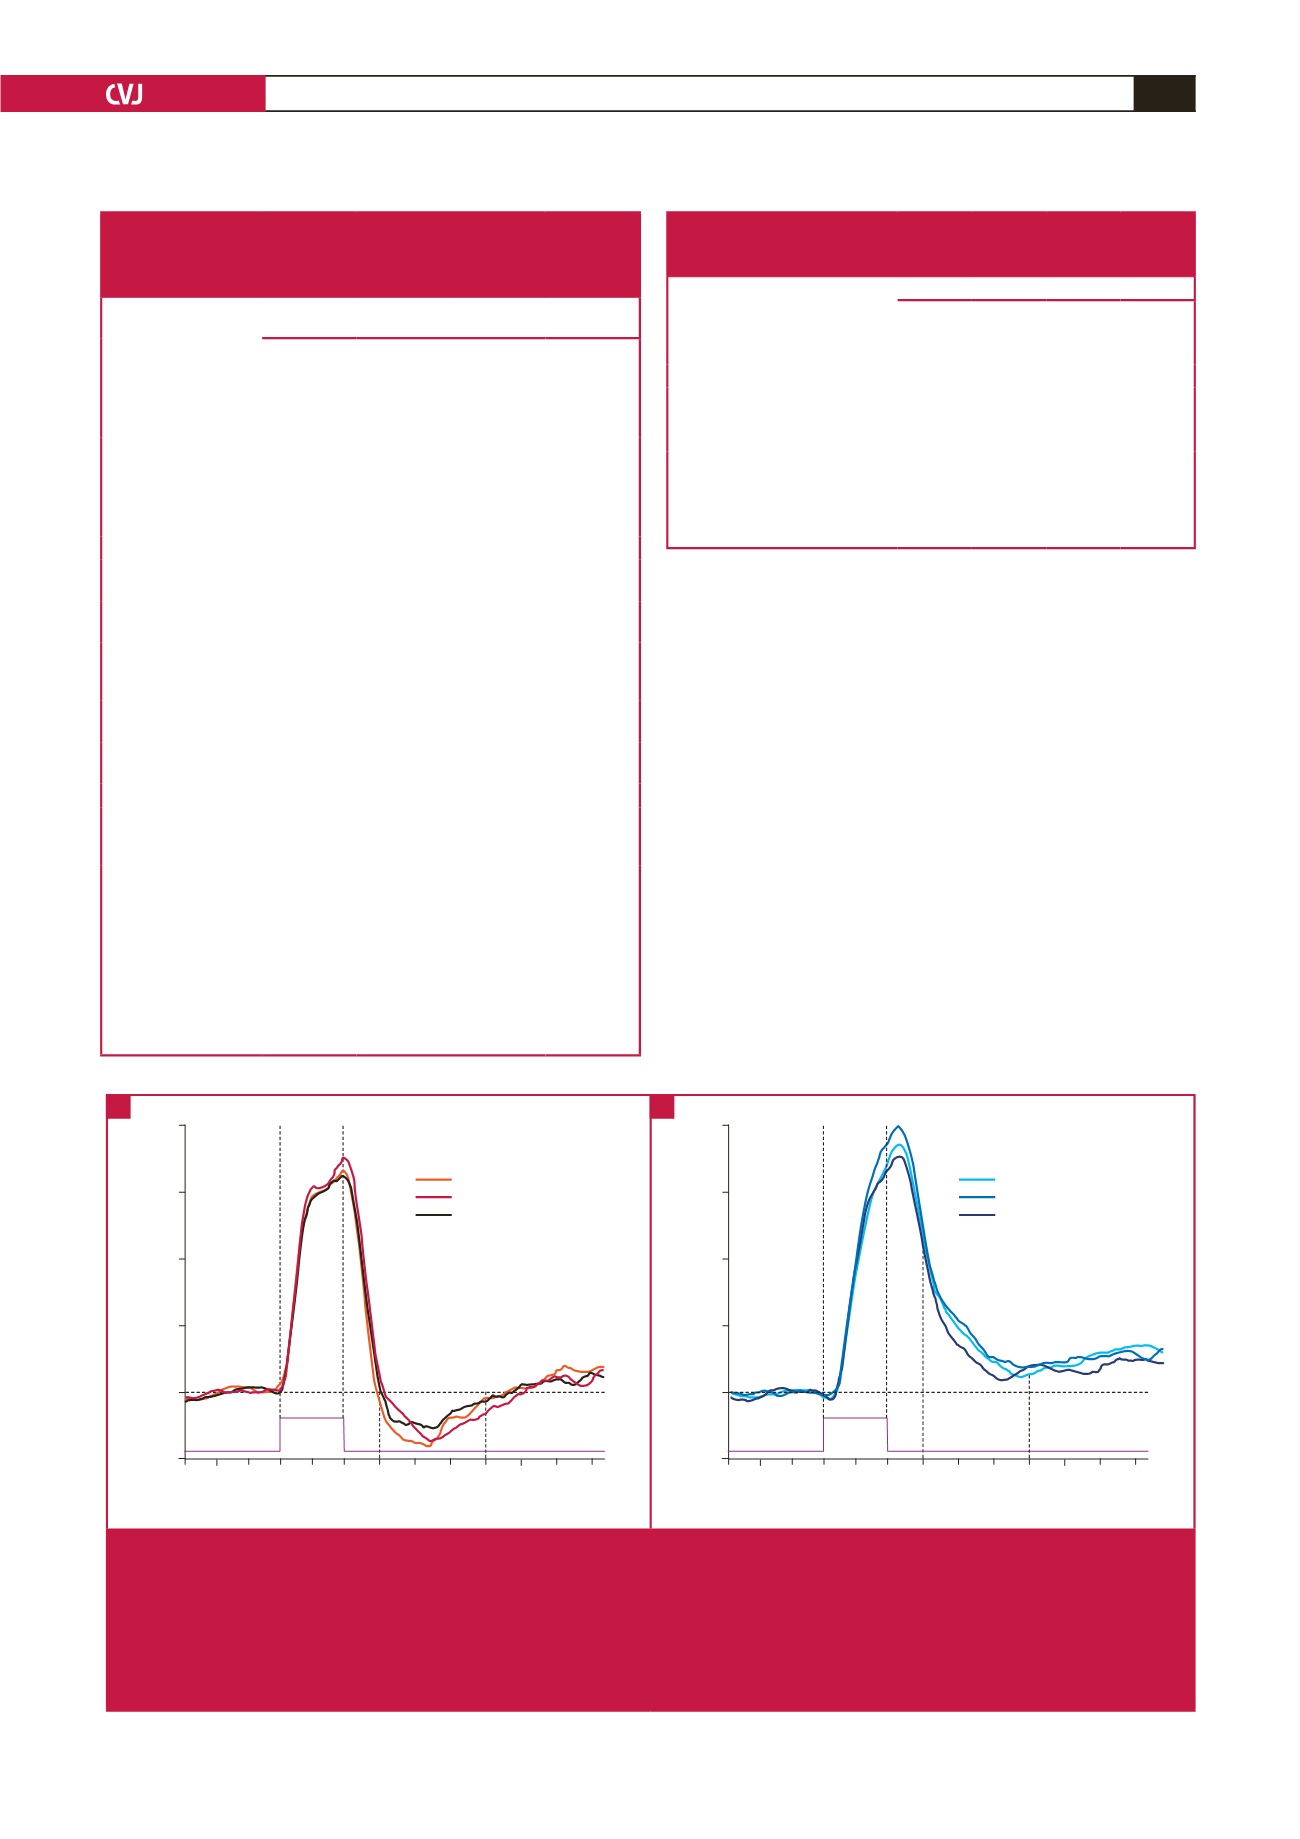
Fig. 3.
Comparing median retinal artery (A) and vein (B) responses during monochromatic flicker light-induced provocation (FLIP)
in increasing norepinephrine:creatinine (u-NE nmol/l:mmol/l) tertiles. Exact
p
-values were determined with Mann–Whitney
U
-tests. Grey vertical stripes indicate the time interval 10–40seconds after flicker cessation where arterial constriction
and an emphasised decrease of venous diameter are expected. Delayed vein recovery responses (% of baseline) were
determined by calculating the average vessel diameter between 50 and 80 seconds after the end of flicker. u-NE tertile 1,
median (min–max): 8.74 (1.05–14.77); u-NE tertile 2, median (min–max): 21.23 (15.05–28.62); and u-NE tertile 3, median
(min–max): 40.62 (28.69–113.63).
B
A