


 13 / 61

CARDIOVASCULAR JOURNAL OF AFRICA • Volume 32, No 4, July/August 2021
AFRICA
185
assessment of the axial sections of CTA scans or reconstructive
volumetric measurements could also be performed.
It has previously been reported that volumetric measurements
could more precisely detect the size of the AAA and result in less
variation between observers.
2
Since volumetric measurements are
three dimenational, they can detect minor changes compared
to two-dimensional diameter changes.
1,6
Two-dimensional
measurements are inadequate, especially in areas with an
irregular aneurysm wall; they can be used for the assessment
of a single section instead of examining the whole structure.
Therefore, in our study, we preferred assessment of volumetric
changes rather than changes in diamter.
When volumetric CTA scans were performed in the third,
sixth and 12 months, any increase in the volume more than
2% from the previous examination could be associated with
endoleaks.
6
A volume regression of 10% or more within six
months and continuous decline over time was considered a
successful endovascular repair.
1
In the present study, mean
TAV had regressed at six and 12 months, while expansion was
observed at 24 months compared to the previous follow-up
examination, but this expansion was not comparable to that of
the pre-operative period.
A decrease in regression at 24 months, or in other words,
restart of the expansion was associated with a TCAWV increase.
Since no endoleak was observed, this could have been associated
with endotension, which is defined as persistent pressure in the
aneursym and continued expansion of the sac with no endoleak.
7
This may be caused by high hydrostatic pressure in the graft
and its associated impact on porosity and transmission. In
addition to hydrostatic pressure, recent data suggest that a fluid
called ‘permeat’, which is accumulated inside the sac due to
thrombolytic activity but is located outside of the graft, could
also be involved in endotension.
8
Mean TCAWV, which indicates changes in thrombus load,
partially increased at six months compared to the pre-operative
period, but then started to decline at 12 and 24 months. However,
the increase at 24 months was similar to that of the TAV. The
increase in the sixth month could have been associated with
inferior mesenteric and lumbar artieries causing a type II
endoleak. The use of anti-aggregants by the patients could also
have caused these results.
Mean PLV was significantly reduced at six months compared
to the pre-operative period. Similarmean PLVwere obtained from
six-, 12- and 24-month measurements. The first measurement
showing the internal volume of the stent graft following EVAR
was performed at six months, therefore it could be expected that
there would be a decline in volume at six months. Similar results
obtained at six, 12 and 24 months suggest that there were no
major changes in PLV following the stent graft placement.
In order to observe in which region and to what extent the
volume change occurred in the aneurysm sac, it was divided into
three regions: proximal, middle and distal. The results obtained
from these regions were similar to that obtained from the TAV.
There was a regression at six and 12 months and an expansion
at 24 months compared to the previous follow up. However, the
expansion observed at 24 months was not comparable to that of
the pre-operative period.
Even though the total regressions were similar, the distal
portion displayed the largest regression, followed by the proximal
and then the middle portions. The least regression observed
in the middle portion could be associated with the weakest
aneurysm sac present in this location.
It is known that EVAR reduces mortality rate in the peri-
operative period and first six months compared to open
surgery.
9,10
Controversial results have been reported regarding
long-term effects of EVAR. Similar mortality rates have been
reported from six months to eight years. However, after eight
years, the EVAR group showed higher mortality rates.
10
In another study, the first three years’ survival rate was
significantly higher in EVAR compared to open surgery.
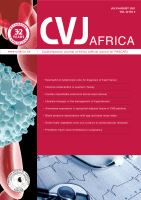
Time
Month 24
Month 12
Month 6
Pre-op
TCAWV
> 131cm
3
TCAWV
< 131cm
3
400
300
200
100
TAV (mean)
Mean. 95% confidence limits
Fig. 9.
The change in TAV over TCAWV (below and above
131 cm
3
).
100
125
150
175
200
225
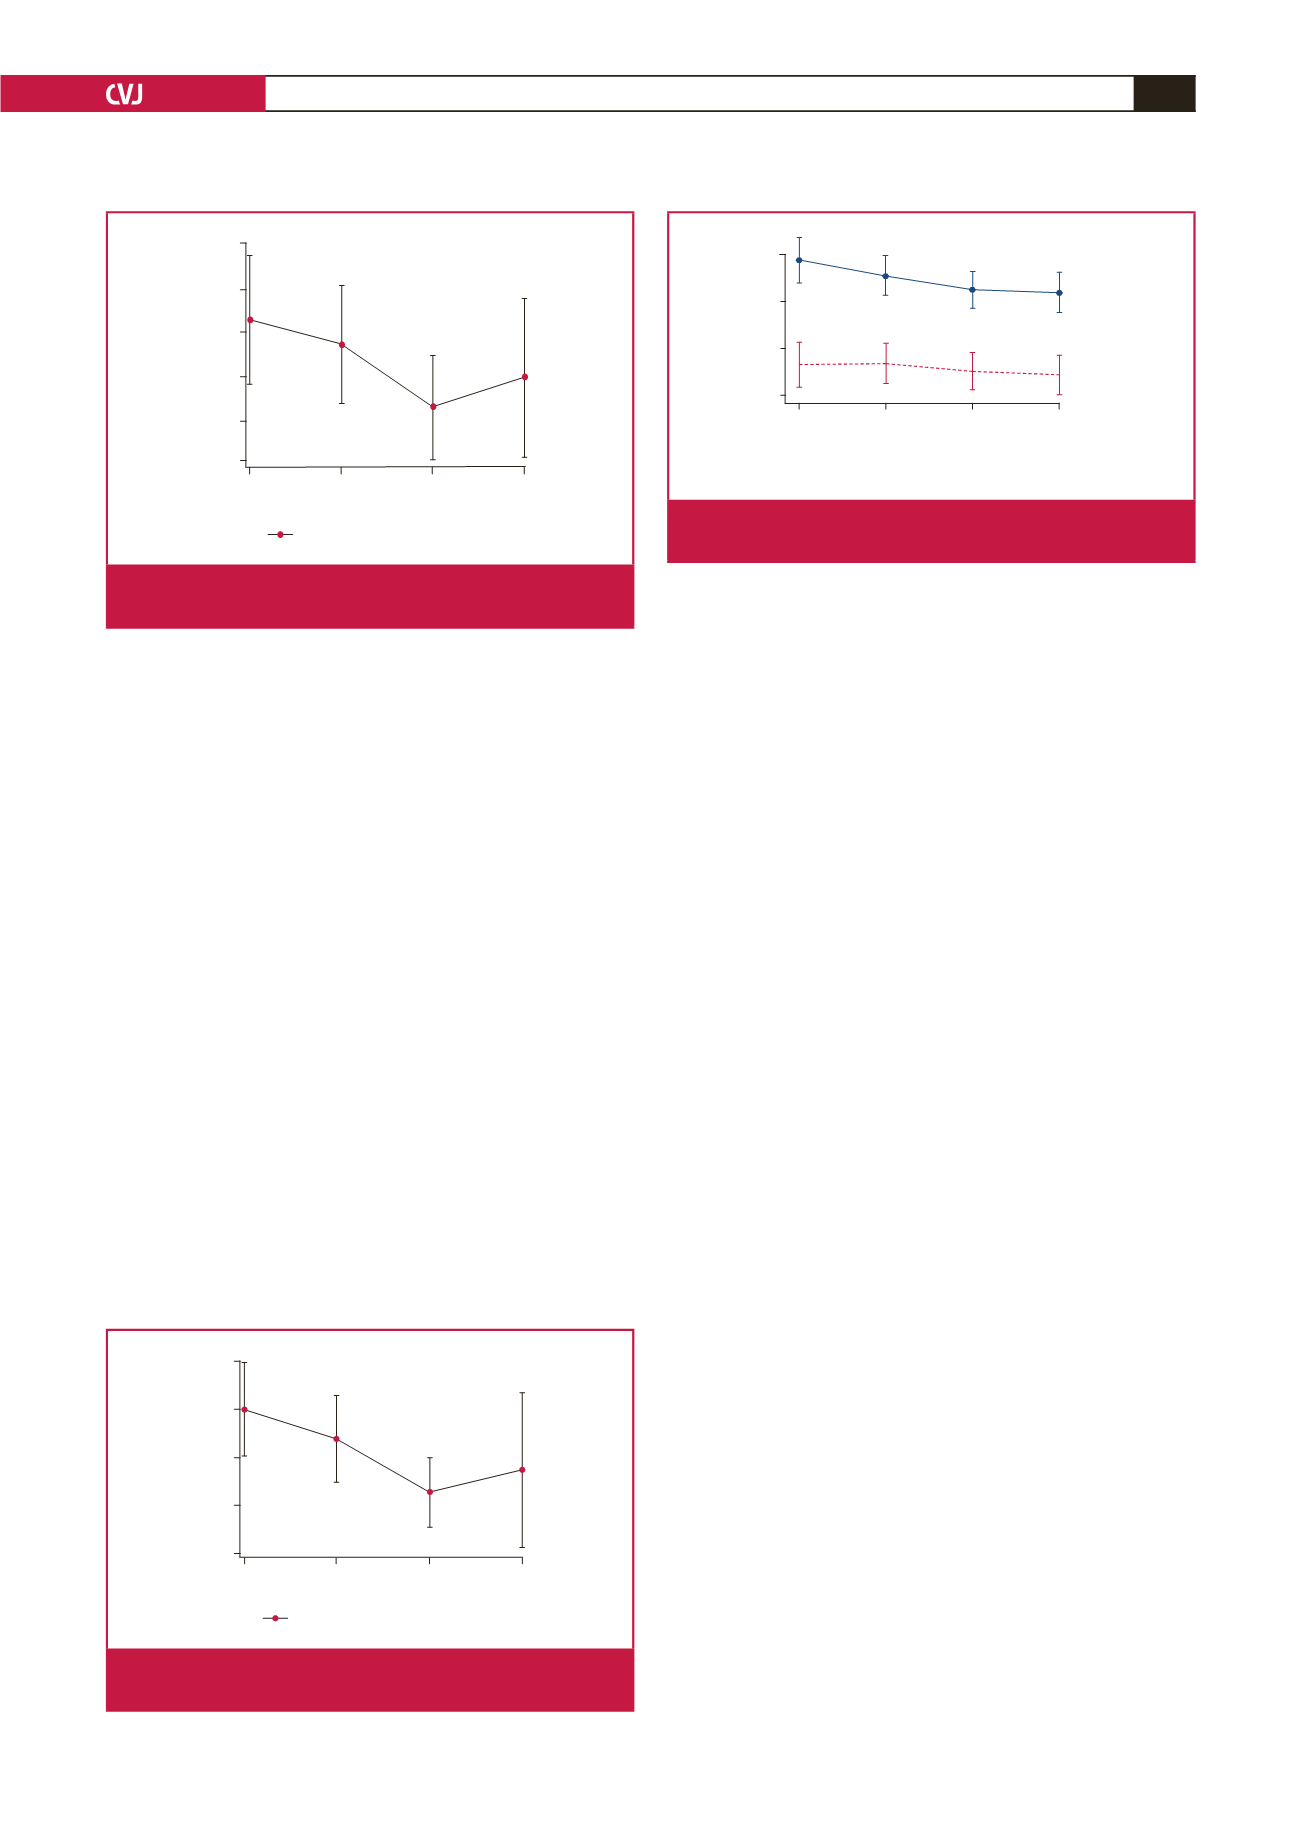
Middle (mean)
Pre-op Month 6 Month 12 Month 24
Time
Mean. 95% confidence limits
Fig. 7.
The change in the middle portion of the mean aneu-
rysm sac volume over time.
30
40
50
60
70
Distal (Mean)
Pre-op Month 6 Month 12 Month 24
Time
Mean. 95% confidence limits
Fig. 8.
The change in the distal 2-cm portion of the mean
aneurysm sac volume over time.