


 8 / 61

CARDIOVASCULAR JOURNAL OF AFRICA • Volume 32, No 4, July/August 2021
180
AFRICA
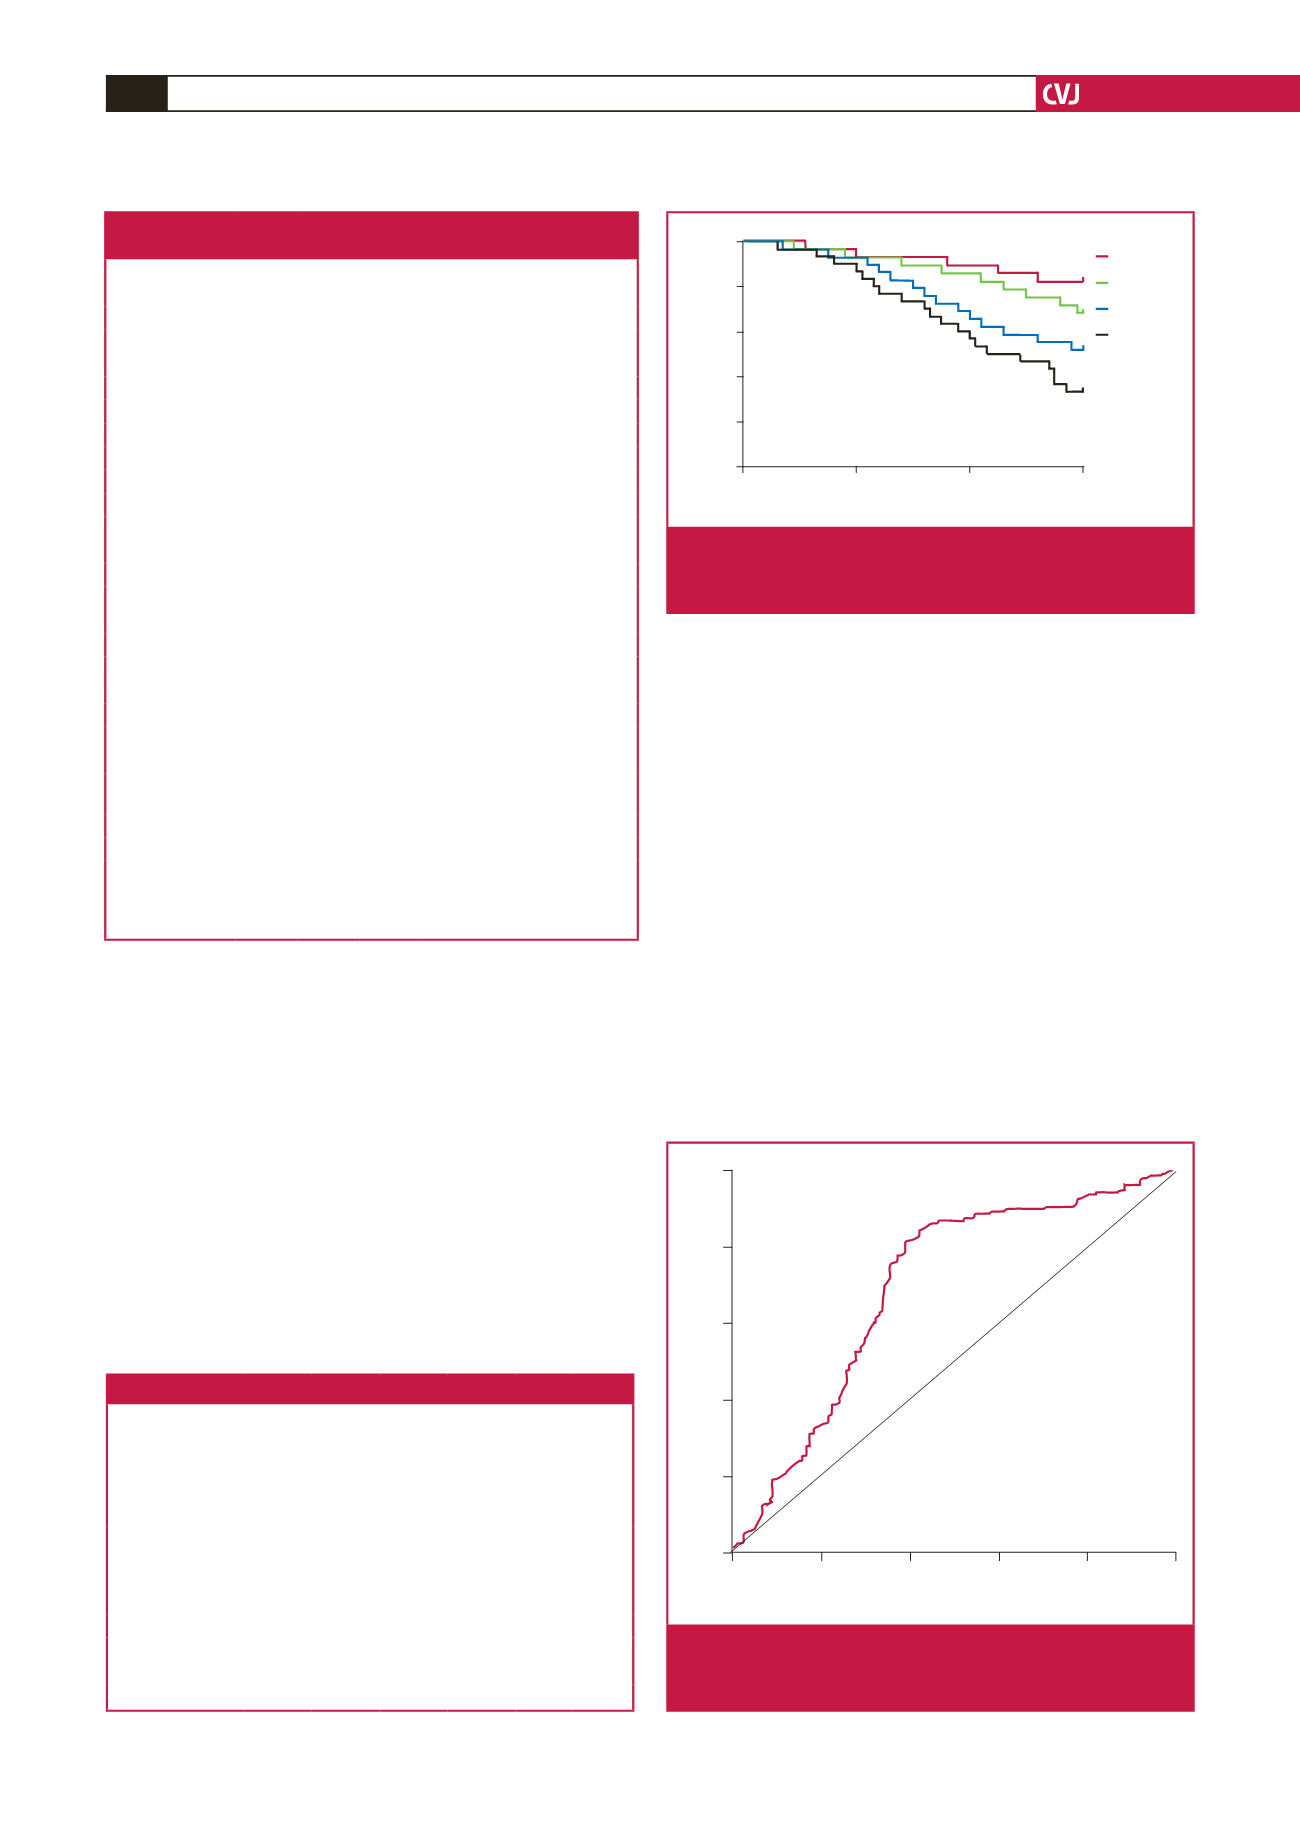
0.002, group A vs group D;
p
= 0.001, group B vs group C;
p
=
0.009, group B vs
group D;
p
= 0.011, group C vs
group D;
p
=
0.018) (Fig. 1).
The ROC curves showed that the area under the curve,
optimal cut-off value, sensitivity and specificity of NLR for
MACE in patients with CHF and AF were 0.879 (95% CI:
0.801–0.978,
p
< 0.001), 3.12, 72.39% and 86.18%, respectively
(Fig. 2).
Discussion
CHF is a clinically common and frequently occurring disease.
The proportion of patients with HF in the total population is
as high as 2–3%, even in developed countries.
7
AF is a common
type of arrhythmia and also has a high rate of incidence. HF and
AF often co-exist, and the rate of incidence of AF in patients
with HF is up to 54%. There is a positive correlation between
the degree of HF and the rate of incidence of AF, and the rate
of incidence of AF in HF patients in NYHA class IV is 10 times
that in patients in class I.
8
There has been a consensus in multiple studies that the
long-term prognosis of patients with HF and AF is poor. Both
chronic diseases seriously affect the quality of life of patients and
impose a heavy burden on the medical system.
9
However, there
are no reliable methods for predicting the prognosis of patients
with CHF and AF. Therefore, we urgently need to find new
markers to improve the early identification of adverse prognostic
events and improve the quality of life of such patients.
AF leads to a decline and even disappearance of atrial
systolic function in patients with HF, it causes irreversible
embolism and a systemic inflammatory response, and reduces
lymphocyte counts in patients, ultimately resulting in a steady
increase in NLR in the blood.
10
It has been confirmed in a large
Table 2. Multivariate logistic regression analysis of
independent predictive factors for MACE
β
SE Wald p-value
OR (95% CI)
Age
< 60
1.000
≥ 60
2.304 0.467 22.657 0.008 10.291 (3.789–24.315)
Smoking history
No
1.000
Yes
2.644 0.854 0.212 0.323 2.32 (0.021–6.544)
Diabetes mellitus
No
1.000
Yes
0.542 0.343 1.743 0.001 1.622 (1.311–3.245)
LDL-C
< 2.30 mmol/l
1.000
> 2.30 mmol/l
0.020 0.010 2.6987 0.001 2.022 (1.987–2.056)
NLR
< 3.50
1.000
> 3.50
1.501 0.341 19.412 < 0.001 4.159 (2.378–8.814)
LVEF
< 50%
1.000
> 50%
–0.432 0.308 58.802 < 0.001 0.657(0.365–0.802)
FPG
< 7.1 mmol/l
1.000
> 7.1 mmol/l
0.759 0.218 11.242 0.014 2.142 (1.391–3.132)
NYHA heart
function class
I + II
1.000
III + IV
0.987 0.458 0.102 0.005 1.854 (2.654–4.654)
FPG: fasting plasma glucose; LDL-C: low-density lipoprotein cholesterol;
LVEF: left ventricular ejection fraction; MACE: major adverse cardiovascular
event; NLR: neutrophil-to-lymphocyte ratio; NYHA: New York Heart Associa-
tion.
Table 3. Prognosis of patients with different NLR values
Group A
(
n
= 62)
Group B
(
n
= 62)
Group C
(
n
= 62)
Group D
(
n
= 62)
χ
2
p
-value
Acute myocardial
infarction
1
5
8
10
8.488 0.037
Congestive heart
failure
1
3
2
2
1.033 0.793
Ischaemic stroke
1
1
1
1
0.000 1.000
Peripheral artery
occlusion
2
2
1
1
0.683 0.877
Recurrent angina
3
3
1
1
2.067 0.559
Severe arrhythmia
2
3
6
10
8.064 0.045
Cardiac death
2
4
8
11
8.674 0.034
Total
12
21
27
36 20.803 < 0.001
NLR: neutrophil-to-lymphocyte ratio.
Time (month)
Group A
Group B
Group C
Group D
0
0
20
20
40
60
80
100
40
60
Survival rate (%)
Fig. 1.
Survival analysis of patients with different NLR values
undergoing MACE. MACE: major adverse cardiovas-
cular event; NLR: neutrophil-to-lymphocyte ratio.
Sensitivity
1 - Specificity
1.0
1.0
0.8
0.8
0.6
0.6
0.4
0.4
0.2
0.2
0.0
0.0
Fig. 2.
Predictive value of NLR for MACE. MACE: major
adverse cardiovascular event; NLR: neutrophil-to-
lymphocyte ratio.